Showing posts with label Oceania. Show all posts

March 16, 2018

Ancient genomes of SE Asia

Just a quick mention because I have such a long queue of stuff from Europe that I really have no time to look but very shallowly onto this study, which looks extremely interesting. Credit for the reference to Kristiina.

Hugh McColl, Fernando Racimo, Lasse Vinner, Fabrice Demeter et al., Ancient Genomics Reveals Four Prehistoric Migration Waves into Southeast Asia, BioRXiv (pre-pub) 2018. doi:10.1101/278374

Abstract

Two distinct population models have been put forward to explain present-day human diversity in Southeast Asia. The first model proposes long-term continuity (Regional Continuity model) while the other suggests two waves of dispersal (Two Layer model). Here, we use whole-genome capture in combination with shotgun sequencing to generate 25 ancient human genome sequences from mainland and island Southeast Asia, and directly test the two competing hypotheses. We find that early genomes from Hoabinhian hunter-gatherer contexts in Laos and Malaysia have genetic affinities with the Onge hunter-gatherers from the Andaman Islands, while Southeast Asian Neolithic farmers have a distinct East Asian genomic ancestry related to present-day Austroasiatic-speaking populations. We also identify two further migratory events, consistent with the expansion of speakers of Austronesian languages into Island Southeast Asia ca. 4 kya, and the expansion by East Asians into northern Vietnam ca. 2 kya. These findings support the Two Layer model for the early peopling of Southeast Asia and highlight the complexities of dispersal patterns from East Asia.


June 7, 2014

Y-DNA macro-haplogroup K-M526 originated in Indonesia

Most probably did, although there is always some uncertainty. This is what a new study demonstrates almost beyond doubt.

Tatiana M. Karafet et al., Improved phylogenetic resolution and rapid diversification of Y-chromosome haplogroup K-M526 in Southeast Asia, EJHG 2014. Pay per view → LINK [doi:10.1038/ejhg.2014.106]

It also demonstrates that "Australasian" haplogroups M and S, as well as several other K sublineages from that area belong to the same subhaplogroup, "brother" of P and "cousin" of NO. 

The sample, focused in SE Asia and Oceania, is quite massive (4413 K-M526 samples) so there is very limited chance that further studies will produce major changes in this understanding. However there are some geographic blanks like Myanmar which can produce surprises when they are finally properly studied. Mitochondrial DNA from the Bamar (ethnic Burmese) showed in a recent study to have very high top-level diversity, suggesting that their ancestors played some key role in the formation of the peoples of Asia and beyond. 

But while we await for those future studies or even the political chance to perform them, let us see what this excellent paper can tell us.

First of all the new data allows for a re-drawing of the K haplogroup tree, including renaming proposals:


For easier understanding, I annotated in red the new version of the tree with the populations carrying each of the sublineages in SE Asia and Australasia (but excluding island Oceania because of its recent colonization date and simplicity). I also annotated in green the proposed timeline of formation of various nodes downstream of K, per this study:


The presence of so many basal haplogroups and paragroups (signaled with an asterisk) in Island SE Asia makes compulsory to accept that K2 (formerly known as K(xLT) or MNOPS and right now listed in ISOGG as just K) but also its descendants K2b, K2b1 and K2b2 (P) must have originated in what is now the Malay Archipelago but was once a large emerged peninsula known as Sundaland. 

This is my reconstruction of the likely centroids of K2 sublineages (named) and the K2* paragroup (stars):


The map originally included several work layers in order to analyze the geographical scatter of the downstream haplogroups within K2b but, for visibility reasons, I chose to to make them invisible. 

Instead I made the following map of approximate plausible routes for the various sublineages of K2:


I must say that K-247, labeled as K2e here but reported as close relative of NO in a previous study, which named it "X", and which is found only in India (reported in two men) may add some extra complexity to the K2a (NO) arrow. It is for example possible that K2a'e and P migrated northwards jointly, splitting ways somewhere in Indochina (K2e migrating to India with P1 and maybe some already formed Q remaining in Indochina as well). This matter however requires more investigation and so far other possibilities such as later independent minor flows between South and SE Asia are equally likely.

Although not detailed enough to capture the nuances of the rare basal sublineages found in the various populations of Island SE Asia, this map may be of help for some in order to illustrate the importance of patrilineal haplogroup K-M526 globally:


Overall this study underlies and vindicates my repeated claim of SE Asia playing also an important role in the formation of the Asian+ branch of Humankind, together with South Asia. Something I have repeatedly suggested is that mtDNA macro-haplogroup N appears to have coalesced in SE Asia, while its most prolific "daughter" R instead seems original from South Asia, but that both have left a legacy East and West of the Brahmaputra regional divide. 

I am not sure on how exactly couple mtDNA N/R with the spread of Y-DNA K2 but it seems almost certain that they are related to a great extent. 

I also suspect that the Toba supervolcano catastrophe may well have caused enough damage to allow for a sudden expansion of one or several human populations after it. I would think that the Toba catastrophe marks the beginning of the expansion of Y-DNA K2 and mtDNA N, although it is quite possible that some other lineages like C were also involved in secondary roles in this secondary, yet so influential, expansion in Asia and Oceania.

Another possible element which may have aided this expansion could be dog domestication, which, although so far cannot be documented before 33,000 years ago in Altai, is suspected to have happened first in SE Asia.

May 17, 2013

The human colonization of Australia and Near Melanesia

Continuing with the joint series of articles on the expansion of Homo sapiens, David Sánchez published last week an interesting piece[es] on the original colonization of Australia and Papua at Noticias de Prehistoria - Prehistoria al Día, which I'll try to synthesize here.

Earliest evidences of human occupation of Australia and Near Melanesia (all before 30 Ka BP)

Maybe the most interesting detail is that Lake Mungo 3 has dates that clearly establish a colonization of the continent at least 60,000 years ago:

81.000 +- 21.000 U (Uranium series)
62.000 +- 6.000 ESR/U (Electron spin resonance/Uranium)
61.000 +- 2.000 OSL (Optical Stimulated luminiscence)
40.000 +- 2.000 OSL (Optical Stimulated luminiscence)

The sites of Nauwalbila I and Malakunanja II have provided similar dates: 60-50 Ka BP (OSL) and 61,000 BP +9,000/-13,000 (TL) respectively. So we can safely discard the conservative approach that only allowed for at most 50 Ka as earliest colonization boundary for the Oceanian continental landmass. 

The depiction of a Genyornis, giant duck-like bird extinct before 40 Ka, in Australian rock art ago also supports a very early date for the settlement of Australia. In Highland Papua human presence is also confirmed to at least 49 Ka ago, as I reported in 2010.

Naturally the settlers must have arrived by sea, the most commonly accepted candidate for such a vessel is a humble raft still used by some Papuan populations and which has parallels in Southern Asia (also still in use in some places):


Such a journey was attempted with a similar but larger raft, equipped with a simple sail named Nale Tasih 2. This craft had no trouble in reaching the continental platform of Australia from Timor in just six days and they actually managed to reach the modern Australian coast, although they desisted of beaching by night in the middle of a storm in an area infested by the largest crocodiles on Earth, being evacuated by the coastguard instead (the barge was later recovered in perfect state).

April 22, 2013

Australian Burrup Peninsula's rock art is 30,000 years old

The open air engravings have managed to survive thanks to the extremely low erosion rates produced by the hardness of the rock combined with the local climate. 


The petroglyphs have been dated using the isotope beryllium-10. Based on current evidence, the archaeologists say, the occupation of the peninsula cannot be dated to before c. 42,000 years ago. 

Source: Australian Geographic.

February 28, 2013

Northern Marianas was first colonized from Philippines

Lapita pot from Tonga (source)
The first known colonists of Tinian (Northern Marianas) were people coming from Luzon and using a kind of red painted pottery which is also found in Northern Luzon, Philippines, similar to  Lapita (Island Melanesia, Polynesia).

However these people seem to have arrived to the Marianas a century or two before the Lapita carriers (precursors of Oceanic languages) reached Melanesia, according to Peter Bellwood.

Source and more details: Islands Business (interview with Bellwood), via Pileta.


See also:

February 18, 2013

Submerged rock art from Papua

In the World-famous diving paradise of Raja Ampat, just West of the Bird's Head peninsula of Papua (aka New Guinea), there is more than one of the greatest biodiversity areas of the planet. It has been found recently that off the shore of Misool, one of the major islands of the archipelago, there is also abundance of beautifully conserved Paleolithic murals.


The now submerged rock art is found in 13 different sites (so far), most of them sharing an intriguing pattern of location:
  • a large and rather high cliff;
  • a cavity, cave, overhang or hole around the foot of the cliff;
  • a main coloured (red-yellow to red-brown) wide strip pouring out, or reaching down to the cavity;
  • a (facultative) step-bank (coral or karst platform) at the foot. 
The art was obviously above the water level until the sea flooded all that area at the end of the Ice Age. 

Sources: World Archaeological Congress, Stone Pages' Archaeonews.


Update (Feb 24): after being down for days, causing perplexity among some readers and myself, the WAC source site is up again. Exactly as it was four days ago. Just in case this time I'll upload the images here. 

December 21, 2012

Mitochondrial DNA haplogroup Q in Oceania

Even if a very specialized detail, this lineage may help to shed light on the colonization of Oceania:

Chris A. Corser et al., The Q2 Mitochondrial Haplogroup in Oceania. PLoS ONE 2012. Open access → LINK [ doi:10.1371/journal.pone.0052022]

Abstract

Many details surrounding the origins of the peoples of Oceania remain to be resolved, and as a step towards this we report seven new complete mitochondrial genomes from the Q2a haplogroup, from Papua New Guinea, Fiji and Kiribati. This brings the total to eleven Q2 genomes now available. The Q haplogroup (that includes Q2) is an old and diverse lineage in Near Oceania, and is reasonably common; within our sample set of 430, 97 are of the Q haplogroup. However, only 8 are Q2, and we report 7 here. The tree with all complete Q genomes is proven to be minimal. The dating estimate for the origin of Q2 (around 35 Kya) reinforces the understanding that humans have been in Near Oceania for tens of thousands of years; nevertheless the Polynesian maternal haplogroups remain distinctive. A major focus now, with regard to Polynesian ancestry, is to address the differences and timing of the ‘Melanesian’ contribution to the maternal and paternal lineages as people moved further and further into Remote Oceania. Input from other fields such as anthropology, history and linguistics is required for a better understanding and interpretation of the genetic data.

Figure 2. Overview of the Q haplogroup.
The dataset has 36 mitochondrial genomes including all eight Q3 sequences, 17 Q1, three Q2 genomes from Friedlaender et al. [28], one from Hudjashov et al. [36], together with the seven additional Q2a genomes reported here. The network has been proved the shortest possible (the minimum number of mutations) by using the techniques in Pierson et al. [40]. Differences in branching between the four equally parsimonious trees occur in the Q3 subgroup.

See also in this blog:

November 16, 2012

High precision dating: first Polynesian settlement was in 2838±8 BP

That si Nukuleka, Tonga, and translates as 888±8 BCE (remember that BP means "before 1950").

David Burley et al., High Precision U/Th Dating of First Polynesian Settlement. PLoS ONE 2012. Open access ··> LINK [doi]

Abstract

Previous studies document Nukuleka in the Kingdom of Tonga as a founder colony for first settlement of Polynesia by Lapita peoples. A limited number of radiocarbon dates are one line of evidence supporting this claim, but they cannot precisely establish when this event occurred, nor can they afford a detailed chronology for sequent occupation. High precision U/Th dates of Acropora coral files (abraders) from Nukuleka give unprecedented resolution, identifying the founder event by 2838±8 BP and documenting site development over the ensuing 250 years. The potential for dating error due to post depositional diagenetic alteration of ancient corals at Nukuleka also is addressed through sample preparation protocols and paired dates on spatially separated samples for individual specimens. Acropora coral files are widely distributed in Lapita sites across Oceania. U/Th dating of these artifacts provides unparalleled opportunities for greater precision and insight into the speed and timing of this final chapter in human settlement of the globe.

Very handy after the recent endless circular discussions. Polynesians this? Polynesians that? Polynesians only since 890 BCE, not before! Earlier related cultures of Lapita were not yet Polynesians but generically Oceanic and mostly of Melanesian stock.

Importantly there are good reasons to consider Nukuleka as the founder site of Polynesia:

The status of Nukuleka as a founder colony is verified through four lines of evidence. First, while limited, Nukuleka radiocarbon dates are the earliest for any Lapita site in Polynesia (Table S1). Second, decorated ceramics from Nukuleka incorporate an assemblage of Lapita wares similar to those recovered from earlier Lapita sites in island Melanesia to the west of Tonga. These are markedly different from later Lapita ceramics in West Polynesia, and Nukuleka is the only site in West Polynesia where these early ceramics occur [9]. Third, a subset of the ceramic assemblage with the earliest Lapita designs is foreign to Tonga, based on petrographic analysis of ceramic temper sands and sherd geochemistry [4]. These pots were transported from the ancestral homeland of the Nukuleka colonizers, a homeland that has yet to be identified. And fourth, the settlement at Nukuleka expanded over a 20 ha area on the Nukuleka Peninsula during the 200–250 year period of Lapita occupation [9]. Nukuleka became a central place for Lapita peoples in West Polynesia as well as a gateway community for expanded settlement.

So it is very likely that the somewhat famed founder effects of Polynesians peoples (Y-DNA C2a and O3a2, mtDNA B4a1a1) were dominant already at this site in this date. However I must say that a second founder effect at nearby Samoa (not considered here), which has a much more similar Y-DNA to Eastern Polynesia, can be taken for granted also.

See also:

November 8, 2012

Hawaiian genetic study shows 2-1 Asian-Melanesian admixture in Polynesians

Queen Liliuokalani of Hawaii in her youth
Native Hawaiians still make up some 38% of the population of Hawaii but most of them have mixed ancestry nowadays. This new study may help to understand them better and also includes some interesting findings about the overall origins of Polynesians, whose Melanesian ancestry is revealed as very significant.

Sung K. Kim et al., Population Genetic Structure and Origins of Native Hawaiians in the Multiethnic Cohort Study. PLoS ONE 2012. Open access ··> LINK [doi:10.1371/journal.pone.0047881]

Abstract

The population genetic structure of Native Hawaiians has yet to be comprehensively studied, and the ancestral origins of Polynesians remain in question. In this study, we utilized high-resolution genome-wide SNP data and mitochondrial genomes of 148 and 160 Native Hawaiians, respectively, to characterize their population structure of the nuclear and mitochondrial genomes, ancestral origins, and population expansion. Native Hawaiians, who self-reported full Native Hawaiian heritage, demonstrated 78% Native Hawaiian, 11.5% European, and 7.8% Asian ancestry with 99% belonging to the B4 mitochondrial haplogroup. The estimated proportions of Native Hawaiian ancestry for those who reported mixed ancestry (i.e. 75% and 50% Native Hawaiian heritage) were found to be consistent with their self-reported heritage. A significant proportion of Melanesian ancestry (mean = 32%) was estimated in 100% self-reported Native Hawaiians in an ADMIXTURE analysis of Asian, Melanesian, and Native Hawaiian populations of K = 2, where K denotes the number of ancestral populations. This notable proportion of Melanesian admixture supports the “Slow-Boat” model of migration of ancestral Polynesian populations from East Asia to the Pacific Islands. In addition, approximately 1,300 years ago a single, strong expansion of the Native Hawaiian population was estimated. By providing important insight into the underlying population structure of Native Hawaiians, this study lays the foundation for future genetic association studies of this U.S. minority population.


In my understanding, the most interesting elements from this study are the ADMIXTURE analyses:

Figure 1. ADMIXTURE clustering of Native Hawaiians for K = 5 (A) and K = 6 (B). Figures 1A and 1B illustrate the clustering of Native Hawaiians and HGDP samples based on GWAS data.

As the general Admixture analysis was not really conclusive about the Melanesian and Asian affinities of Native Hawaiians, the authors also performed a supervised K=2 analysis:

Figure 4. Supervised ADMIXTURE results for K = 2...

This appears to show rather unmistakably that Hawaiians (and by extension surely also other Polynesians, very close in genetics and history across the Pacific Ocean) have an important amount of Melanesian genetics, consistent with the "Slow Boat" model and the relevance of Melanesian Y-DNA haplogroup C2a among all Polynesian populations.

October 28, 2012

The genetic and phenotype complexity of the Oceanic language area

In this entry, rather than discussing Polynesians alone, which seem to be just the tip of the Eastern Austronesian iceberg, I'll try to understand here the complexity of speakers of Oceanic languages, the main native language family of Island Oceania. 

Oceanic is a branch of Austronesian but for the purposes of this entry we will only mention other Austronesian peoples/languages tangentially. The focus is Oceanic because we can't understand the parts without the whole here most probably. 


Linguistics

Oceanic languages are scattered as follows:

  Admiralties and Yapese
  St Matthias
  Western Oceanic and Meso-Melanesian (two distinct sub-families)
  Temotu
  Southeast Solomons
  Southern Oceanic
  Micronesian
  Fijian–Polynesian
Black enclosed zones are pockets of languages from other families.
(CC by kwami)

It is certainly interesting that Micronesian and Fijian-Polynesian seem to be particularly related among them. Instead the Western Oceanic and Admiralty subfamilies (both from the islands near Papua) seem to have separated early on or diverged farther for whatever other reasons (stronger substrate influence for example).


Prehistory

Lapita pot from Tonga (source)
As I cited recently, Polynesians seem to have spread from Society Islands in the 1190-1290 CE window. The genesis of the Micronesian family is not well understood... but the overall genesis of Oceanic languages seems to be at the Lapita culture, which spread through Island Melanesia (excluding Papua) and some nearby islands (notably Tonga and Samoa - also Marquesas c. 300 CE(ref)).

Early Lapita culture is dated to c. 1350-750 BCE, while a Late phase is dated to c. 250 BCE, spreading to the Solomon Islands, which show no indications of the earlier period (Ricaut 2010, fig. 2).

So a simplified chronology for Oceanic expansion would be
  1. Lapita culture from near Melanesia to Vanuatu and Kanaky (New Caledonia), then to:
    1. Fiji, Samoa and Tonga since c. 900 BCE
    2. Solomon Is. c. 250 BCE
  2. Arrival to Society Islands (Tahiti, etc.) c. 300-800 CE from maybe Samoa.
  3. Main Polynesian expansion to the farthest islands (Hawaii, Rapa Nui, Aotearoa-NZ) c. 1200 CE from Society Is.

Phenotype ('race')

A classical and unavoidable element in the ethnographic division of the region is phenotype, appearance (i.e. 'race'). Since the first European arrival to the area the division between black Melanesians and white Polynesians (very relative as we will see now) has been part of all our conceptualizations of the region. 

Conscious of that and wanting to get a better impression I collected from the Internet what I estimate may be representative faces from the Oceanic linguistic zone and nearby areas (other Austronesians and Melanesians) and put them on a map:

Click to expand

A relatively homogeneous Polynesian phenotype can be identified and one can imagine that it stems from the area of Samoa-Tonga, considering the previous prehistorical review. But otherwise the diversity, gradations and abundance of local uniqueness seems quite impressive.

Based on other cases, one would imagine also that phenotype differences would be coincidental with genetic ones. However this is not too easy to discern, partly because Polynesians have strong founder effects that blur the matter, partly because there is no obvious strict dividing line between the various phenotypes and partly because of the insistence of some in considering Lapita as a Polynesian phenomenon, when it is obviously an Oceanic one, including and emphasizing the Melanesian side of the diverse Oceanic landscape, of which the Polynesian-Micronesian branch is just one element (famous and extended but not the core). 


Genetics

The main Y-DNA lineage among Polynesians is C2a1 (P33), not found outside Polynesia senso stricto but reaching there frequencies of 63-90% (excepted Tonga where it's only 33%). This is a clear founder effect in this population.

C subclades in SE Asia and Oceania
(from Karafet 2010, annotated with ISOGG nomenclature)


C2a1 is clearly derived from a Melanesian superset C2a (M208) still found as C2a(xC2a1) at low frequencies in Samoa (8%) and Tahiti (4%) but also in Vanuatu (2%) and coastal Papua (13%). C2a establishes a probably genetic link of Polynesians with Lapita culture and Melanesian peoples in general.

An earlier pylogenetic stage is C2 (M38), which is probably in the region since the very first colonization process some 50 thousand years ago (or maybe even earlier). C2(xC2a) is most common in Wallacea (East Indonesia, East Timor), where it reaches maybe figures of 33% on average. It is however also found in highland Papua (13%) and Vanuatu (20%) but as it is most doubtful that C2a evolved as recently as Lapita times, we should really focus on C2a as such rather than the wider C2, which only seems to confuse the matter.

The lack of C2(xC2a) in most of the Oceanic languages' area clearly indicates that the expansion (and subsequent founder effects) did not begin in Wallacea but in  Melanesia, at least in what regards to C sublineages.

The other major Polynesian haplogroup is O3a2 (P201), which would seem to have originated in Philippines and maybe arrived there via Micronesia:

O3 subclades in SE Asia and Oceania
(from Karafet 2010, annotated with ISOGG nomenclature)

Melanesian populations also sport some lineages that are not common among other Oceanic-speaker peoples, notably K, M and S. However they are irregularly shared with Wallacea (Eastern Indonesia, East Timor). Like C2 these lineages coalesced in the region soon after colonization by Homo sapiens.

In the motherly side of things genetic, the absolutely dominant mtDNA lineage among Polynesians (the so-called Polynesian motif) is B4a1a1, which ultimately stems from East or rather SE Asia. However it probably arrived to the region (again) via Melanesia, albeit maybe somewhat tangentially.

From Friedlander 2007 (fig. 4)
Spatial frequency distribution of haplogroup B4a* and B4a1a1 in Island Southeast Asia and the western Pacific, created using the Kriging algorithm of the Surfer package of haplogroups. Figure 4b presents the detailed distribution for Northern Island Melanesia. Data details are provided in table S3.

The matrilineal Polynesian motif does offer a possible pattern of settlement, maybe related specifically to Late Lapita, that could allow us to understand the possible origin of the phenotype differences between Melanesians and Polynesians, as could do the Y-DNA lineage O3a2. However there are lots of remnants of quite strictly Melanesian Early Lapita, as is evident by the (Y-DNA) C2a lineages retained so strongly among Polynesians within their own founder effects, whose importance we cannot afford to dismiss.

Other mtDNA lineages like Q1 or M27 are of relevance in Melanesian populations. Q1 did make its way into some Polynesian populations but as minority lineage only.


Update (Oct 31):

Terry in the comments sections grunts a lot but now and then provides useful complementary data, for example this Y-DNA map of the region from Kayser 2006:


Kayser 2006 - fig. 1
Frequency distribution of (A, B) NRY and (C, D) mtDNA haplogroups found in Polynesia with a genetic origin in (A, C) Asia or (B, D) Melanesia.

As is apparent since Kayser's publication (if not before), the Melanesian patrilineages are much more common (actually dominant) among Polynesians than the matrilineages from the same origin, what is attributable to a founder effect related to the Lapita culture.

Another interesting reference is this Y-DNA map of Papua (New Guinea) and some nearby islands (from Mona 2007):

Mona 2007 FIG. 2.—Y-chromosome haplogroups and their frequencies in populations from the Bird’s Head region and elsewhere in New Guinea. Data from other populations of New Guinea were used from previous studies (Kayser et al. 2003, 2006). Size of the pie charts is according to sample size of the groups. Abbreviations are as in supplementary table S1, Supplementary Material online.


Both maps and/or the data in the relevant papers provide key information on possible origins for the C2a-M208 patrilineal founder effect, so important in general in the Oceanic peoples and specially the Polynesian branch. The exact origin cannot be pinpointed without further research (or maybe not at all) but it's clear that C2a-M208 only exists from Papua (New Guinea) to the East, so it must have a Melanesian origin be it Papuan or from the nearby islands.


Bibliography
  • François-Xavier Ricaut et al., Ancient Solomon Islands mtDNA: assessing Holocene settlement and the impact of European contact. Journal of Archaeological Science, 2010 ··> LINK (PDF).
  • Jonathan S. Friedlaender et al., Melanesian mtDNA Complexity. PLoS ONE, 2007 ··> LINK (open access).
  • Tatiana Karafet et al., Major East-West Division Underlies Y Chromosome Stratification Across Indonesia. MBE 2010 ··> LINK (free access).
  • Michael Knapp et al., Complete mitochondrial DNA genome sequences from the first New Zealanders. PNAS 2012 ··> LINK (open access).
  • Manfred Kayser et al., Melanesian and Asian Origins of Polynesians: mtDNA and Y Chromosome Gradients Across the Pacific. MBE 2006 ··> LINK (open access).
  • Stephano Mona et al., Patterns of Y-Chromosome Diversity Intersect with the Trans-New Guinea Hypothesis. MBE 2007 ··> LINK (free access).

_________________________________________________________________________________
Note: updates after first posted version in maroon color.

October 24, 2012

Ancient Maori mtDNA

Terry points me to this paper:

Michael Knapp et al., Complete mitochondrial DNA genome sequences from the first New Zealanders. PNAS 2012. Open access ··> LINK [doi:]

Abstract

The dispersal of modern humans across the globe began ∼65,000 y ago when people first left Africa and culminated with the settlement of East Polynesia, which occurred in the last 1,000 y. With the arrival of Polynesian canoes only 750 y ago, Aotearoa/New Zealand became the last major landmass to be permanently settled by humans. We present here complete mitochondrial genome sequences of the likely founding population of Aotearoa/New Zealand recovered from the archaeological site of Wairau Bar. These data represent complete mitochondrial genome sequences from ancient Polynesian voyagers and provide insights into the genetic diversity of human populations in the Pacific at the time of the settlement of East Polynesia.

The authors sequenced ancient mtDNA from the pre-colonial period from a museum material being returned for proper reburial. The remains belong to a population from Wairau Bar from the 13th-14th centuries, which were looted by British museums in the mid 20th century. 

Of the 19 individuals researched, only four provided valid sequences. All four Three were within the so-called Polynesian motif or haplogroup B4a1a1a, the other was Q1, a lineage of Melanesian origin also found, albeit rarely, among other Polynesians. All modern studied Maoris are B4a1a1a but Q1 is known to exist among Cook Islanders, for example. (Corrected: Q1 is mentioned but in the context of other Polynesian populations, not New Zealand).


Interestingly the authors also explain that the colonization of Eastern Polynesia was performed not in a series of small randomized migrations but in a single expansive wave in the 12th-13th centuries CE, what explains the relative homogeneity of their customs and languages. 

A recent reevaluation of the dates for the colonization of East Polynesia suggests that, contrary to earlier studies positing a relatively long (2,000 y) chronology for the region, the settlement of most of East Polynesia occurred rapidly, in the period from A.D. ∼1190–1290 (22). The authors determined that the expansion event occurred from the Society Islands, which were only settled 70–265 y previously. This rapid and recent expansion event, they argue, explains the “remarkable uniformity of East Polynesian culture, human biology and language” (22).

The cited reference (22) is:
Wilmshurst JM, Hunt TL, Lipo CP, Anderson AJ (2011) High-precision radiocarbon dating shows recent and rapid initial human colonization of East Polynesia. Proc Natl Acad Sci USA 108(5):1815–1820.

July 26, 2012

Ancient DNA... of chickens

Sure, why not?

Alice A. Storey, Investigating the Global Dispersal of Chickens in Prehistory Using Ancient Mitochondrial DNA Signatures. PLoS ONE, 2012. Open access ··> LINK [DOI: 10.1371/journal.pone.0039171]

The authors managed to produce more or less reliable mtDNA haplotypes for 48 remains of historical and prehistorical chickens from Thailand, Pacific Islands, Latin America (a pre-Columbian site in Chile but post-Columbian sites elsewhere) and (medieval) Spain.

Excepting the oldest Thai haplotype, all them belonged to haplogroups D and E, as follows:

Fig. 1
In spite of the authors burying most of the relevant data in the supplemental material, I was able to conclude that the ancient haplotypes (ah) above mean in terms of samples:

  • Haplogroup E:
    • cluster 1:
      • ah1 Pacific Is. (n=1)
      • ah2 Pacific Is. (n=4), Thailand (n=1), Chile (n=1)
      • ah6 Peru (n=1)
    • cluster 2:
      • ah3 Pacific Is. (n=10), Chile (n=2), Spain (n=3), Haiti (n=1), Florida (n=1)
      • ah4 Spain (n=1)
      • ah5 Bolivia (n=3)
      • ah7 Spain (n=1)
  • Haplogroup D:
      • ah9 Pacific Is. (n=1), Peru (n=1)
    • cluster 3:
      • ah10 Pacific Is. (n=14)
      • ah11 Pacific Is. (n=1)
  • Haplogroup B (not shown):
      • ah12 Thailand (n=1)
There is no ah8 apparently. 

It must be noted that the ah9 haplotype from Peru is very early post-Columbian, from before 1600 CE, making it another likely evidence of Polynesian introduction of chicken in South America, along with the Chilean sites (which allow for no other explanation). However the Peruvian haplotype is more related to Micronesia than to Hawaii or Rapa Nui.

Other 17th century samples from Bolivia and Peru (ah5 and ah6) have no obvious connection with either plausible origin. Instead Caribbean sites are probably related to Spain.

A simplified geographical distribution is also offered (oddly enough on a pre-WWI map):

Fig. 2

The authors conclude:

As a result of the careful analysis of archaeologically associated, and in some cases directly dated, ancient DNA samples an early global distribution of haplogroup E chickens has been revealed. This dispersal out of Asia began before 3000 years ago and involved the movement of chickens both westwards to Europe and eastwards into the Pacific. The distribution of haplogroup D likely represents a separate dispersal into the Pacific from a distinct Asian domestication centre. The eventual identification of these centers will greatly enrich our understanding of chicken domestication and the history of dispersals from multiple locations. While unambiguous data does not yet exist to trace any of the detected mtDNA signatures back to specific domestication centers, the analysis of ancient DNA sequences presented here is an important first step towards it. Future research needs to focus on markers identified, from both full mtDNA genomes and nuclear genes which are subsequently targeted in ancient specimens, examined within their historical and/or archaeological context.

December 12, 2011

On the origin of mitochondrial macro-haplogroup N

The notion that the migration of Homo sapiens out of Africa had to pivot around West Asia has been deeply entrenched in our minds, partly because geographical common sense, partly because Eurocentrism, partly maybe because of the Judeo-Christian-Muslim religious background of most influential researchers historically... 

However in the last years this idea has been challenged by the coastal migration theory that proposes a migration mostly along the coasts of the Indian Ocean rather than through the interior of Asia. This theory was first outlined by population geneticists, who needed to explain the facts of haplogroup distribution in Eurasia, not at all more diverse towards the West, as we could expect from the classical models pivoting around the Fertile Crescent, but rather towards the East and very specially in South Asia. Later it has been also corroborated, with lesser shadings maybe, by archaeologists who have sought material support in Arabia and India and found it.

While the origin of mitochondrial macro-haplogroup M in South Asia is seldom contested, that of its "sister" N is seldom agreed upon. The reason is that it is distributed somewhat evenly through all Eurasia, Australasia and even America.

This map, from the Metspalu 2005 paper (open access), illustrates the issue and how even renowned geneticists doubted not long ago on where to place the urheimat of the haplogroup:


The phylogeny has anyhow been refined in these six and a half years and you may notice that Australasia is not even included in the map, although it does play an important role, being surely more important than West Eurasia. In any case the map is illustrative of this state of confusion. Confusion that I will try (once again and hopefully for good) to dispel in this article.


The facts of mtDNA N

Macro-haplogroup N has 15 acknowledged basal haplogroups scattered through all Eurasia and Aboriginal Australia. They have diverse numerical importance but what matters to me here is how many mutations (coding region transitions, to be more precise) they are downstream of the N node. Why? Because this is surely indicative of the timing of their respective expansions in relation with N as such. 

Looking at this measure we find the following classes of N sub-haplogroups:
  • Elder daughters: one coding region mutation downstream of N: N1'5, N9, N11, S and R. Notice that among these R holds a special place, not for any phylogenetic reason but because it has a scatter as wide as that of her mother N, suggestive of a very early coalescence and some sort of association between both expansions. 
  • Two mutations downstream of N: N10 and O.
  • Four mutations downstream of N: N2 (incl. W), A and X.
  • Extremely long stems, rare clades without any known node under N: N8, N13, N14, N21, N22.
This distinction is not very important but I have always present in any case, because it implies that the various classes of subhaplogroups expanded at different moments after the N node. Notably there is a "pause" at the place of the third mutation and then after the fourth. So we can well imagine the expansion of N as a double explosion, first the two first categories and then the third and maybe the fourth.

Representing each haplogroup as a dot, where they might have coalesced (often a hunch within the local region), the result is as follows:

1.- Estimated coalescence of basal subhaplogroups of N

The size of the dots represents only the "class", that is: how many mutational steps they are under N, the larger the closer they are and the earlier they must have coalesced (according to the laws of probability). The peculiar macro-haplogroup R (whose approx coalescence location was estimated in the past and I will not explain here) has been painted of a lighter blue and given a slightly larger size. 

I have also outlined the cloud of N expansion at mutational steps 1 and 2 (no difference), which are followed by an apparent pause at mutational step 3, as mentioned above. The cloud has been pushed northwards a bit in East Asia in order to avoid disputes on where exactly did N9 coalesce (it does not make much of a difference if you prefer Beijing over Shanghai for this clade's coalescence in the end).

Notice that this N cloud is almost identical as would be the M cloud (not shown but look here for a reference if you wish). Whether they were simultaneous or, as I think, N coalesced and expanded a bit after M did, their geography was the same: South Asia, East Asia and Australasia without distinctions. This T-shaped region (with the East on top) was the homeland of the first Eurasian (or more properly non-African) population of Homo sapiens (excepted those who remained in Arabia, which are another story).


The geographic origin of N

Alright, I have described the scatter of N subhaplogroups and the most likely sequence of the expansion but my main purpose here is to estimate the origin, the urheimat of N: where did the N matriarch, the ultimate matrilineal ancestor of all N people today, live?

I apply the statistical principle by which the derived basal haplogroups should tend to remain not too far away from the common origin. Being the most removed ones, exceptions and never the rule. It does makes sense, right?

Hence if we can estimate the centroid of the geometry described by the 15 haplogroups, we will have found the origin of N - or at least a raw estimate of it. There are several methods to estimate centroids but I chose to use the geometric one. In fact, for simplicity, I divided the subhaplogroups in three sets of five (so they all weight the same) and estimated their centroids by geometric decomposition. Then I estimated the centroid of the resulting triangle.

If I am correct the raw centroid of N is at the lower Mekong:

2.- Possible origins of mtDNA N (blue flowers): A - 'raw' geometric centroid, B - corrected against directionality.

I have argued on occasion that, in order to compensate for the directionality of the expansion, a correction can be applied to the geometric centroid or raw estimate of the origin. This correction should pull the origin towards the parent node, in this case L3 in East Africa (estimated here). How much? Maybe 1/4, maybe 1/3... this step, even if probably very reasonable, is a guess and not rocket science. Here I chose to use 1/4 and then look for the closest coast, which is that of Bengal - alternatively I can use a crooked line that follows the geography and get the same result (even less ambiguously Bengal again).

If I would have chosen a 1/3 value for the correction, it would fall in a more central part of India, if 1/5 in Burma surely. We can't be sure of where exactly that happened but we can be more than reasonably sure that it was between India and Cambodia. 

And nowhere else: not in West Asia, not in Altai... thanks for the suggestions but I have heard that before... many times... always without a single piece of evidence nor well-reasoned backing of any sort. 

The data says otherwise: around the Bay of Bengal or even further East maybe. 


Getting R into the picture

I have said before (and is obvious for anyone interested on population genetics) that mtDNA R is peculiar. While it is not different phylogenetically from other subclades of N which are separated by just one coding region mutation, its geographic distribution is very different, because R, like its mother N, is everywhere. 

In order to show it more clearly, I drew approximate origins of all basal R-subclades (in lighter blue). The size of the circles follows the same logic as do those of N above, representing only the distance from the mother node (R in this case, what means one step further downstream in relation with N), and hence a probable order of coalescence:

3.- Scatter of N (deep blue) and R (cyan) subhaplogroups. The flower indicates the possible common origin.

The scatter of R fits very curiously within that of N(xR). They do not overlap too much maybe and it looks on first sight like R could have pushed other N around to the margins of the common expansion cloud. However this does not seem to happen with M, so maybe another explanation is needed, like undifferentiated N and R traveling together, mostly under the leadership of the latter and causing different founder effects in different locations.

Whatever the case it is worth a good meditation, because it is possible that both haplogroups (mother N and daughter R) coalesced in rapid succession in a single region (Bengal probably). 

September 24, 2011

'Denisovan' admixture widespread beyond Wallace Line, non-existant elsewhere

Reconstructed H. erectus
Remember that last Christmas we got an unusual gift of knowledge in the finding by Reich et al. that Melanesians of all modern humans researched back in the day were the only ones to show admixture with the mysterious Denisova fingers?

Remember that I said already back then that this admixture was not with Denisovans as such but a related species (probably H. erectus) of which the Denisova hominings were just the tip of the iceberg and a Neanderthal-admixed tip actually.

I proposed therefore that the admixture shown by Melanesians but not continental Eurasians was probably the product of admixture with H. erectus solensis (or something like that) in Indonesia, while 'Denisovans' were hybrids of H. erectus and H. neanderthalensis, possibly at near 50% levels.

I suggested then this scenario:


With the 2nd admixture representing this regional H. erectus introgression and the 1st one being that from Neanderthals or maybe a related Heidelbergensis-derived population in South Asia (Hathnora hominin).

I also said that the figures of 'Denisovan' admixture had to be cut by half because the authors were counting Neanderthal admixture twice in Melanesians (as 'Denisovans' were probably Neanderthal-Erectus hybrids). Quoting myself:

They suggest (supp. info 8) that Melanesians would have as much as 7.4% of admixture with archaic species: 4.8% Denisovan plus 2.5% Neanderthal. But, if Denisovans are hybrids of H. erectus and H. neanderthalensis (as seems most likely, see above), then the real admixture with H. erectus would be an undetermined percentage but always less than 4.8%. As we know that the Neanderthal (or Heidelbergensis) component is 2.5%, it is most likely that the actual Erectus admixture in Melanesians is of only 2.3% or 2.4%, totaling 4.8%.

Now we are told that all the aboriginal peoples of Near Oceania, plus Wallacea and Filipino Negritos, show that admixture at similar or lower levels:


I could browse the paper a day or so ago, so I hoped this was an open access paper. Yet today I find it is PPV. Luckily Dienekes has published most of the relevant graphs at his blog.

In any case the relevant information is this map (from Neanderfollia[cat]):


It tells us that Papuans and Australian Aborigines share the greatest fraction of 'Denisovan' introgression, followed by Boungaville Melanesians, Fijians, Timorese, Alorese and Mamanwa speakers (probable Ati). These and other peoples of beyond what used to be the continental landmass of Asia in the Ice Age, retain some level of 'Denisovan' admixture. 

But Denisova is very far away and no admixture is known elsewhere. Why? Because the admixture surely happened in or near Indonesia and was not with the Neanderhal-hybridized Denisovans but with pure H. erectus from the region.

Papuans and Australian aborigines have probably 2.4% admixture from H. erectus, in people like the Timorese that would be 1.2% and in a group like the Roti (RO) it is of just 0.6%. That's my interpretation of the available data. 

But from Sundaland to the West and North there is no such admixture: zero!

And that can only be explained if the admixture happened in Indonesia, maybe in Flores?

January 3, 2011

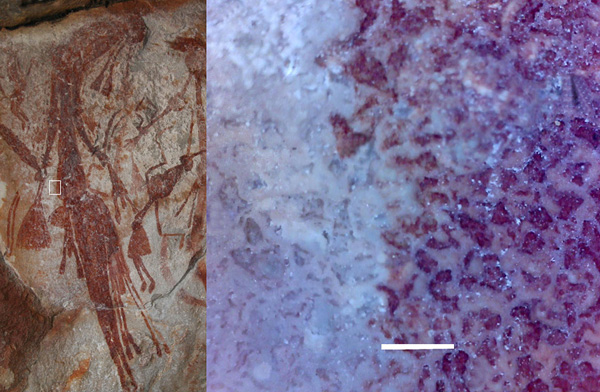
Some rock art of Australia does not retain any paint but pigmented microbes

This is quite unexpected and rather shocking: rock art from Bradshaw, West Australia, keeps no paint all, but remains  drawn and visible because of microbes of red and black colors which have colonized the painted area. 

This makes dating the paintings almost impossible because they are alive, literally so. However the possibility of indirect dating using DNA sequencing remains open.

The implicated microbes are a black fungus and a red bacteria whose species are yet to be identified but which apparently survive cannibalizing their ancestors.

Amplified boundary of a a drawing
Sources: Antiquity, BBC, Stone Pages

December 23, 2010

Denisova hominins, Neanderthals, Melanesians and so on...

A new "bomb" has been dropped by the Paabo team and their Neanderthal Genome Project. This review is just a very preliminary approach to really heavy material, dealing essentially with the autosomal DNA of the Denisova hominins, now sequenced, but also with their relations with Neanderthals and us.

A tooth found in the same cave carried mtDNA very similar to that of the finger bone. The tooth is morphologically distinct from both H. sapiens and H. neanderthalensis.

David Reich et al., Genetic history of an archaic hominin group from Denisova Cave in Siberia. Nature 2010. Pay per view (supplementary material is freely available). 


Denisova closer to Neanderthals?

NJ tree
You are by now probably familiar with the Denisova hominin, a mere finger bone found in a cave from Altai (Mousterian context). While the mitochondrial DNA placed Denisova's lineage almost twice as distant as our divergence from Neanderthals, the autosomal DNA makes Denisovans a closer relative to Neanderthals (left). 

However I'd take this with a pinch of salt because autosomal DNA is subject to admixture and may therefore indicate a hybrid population or even individual. 

For example it could well be the case that Denisovans were a hybrid population of H. erectus and H. neanderthalensis (or a related species such as H. heidelbergensis). Or your best guess.

Also you may notice that in the above tree H. sapiens populations appear unusually divergent. This is not a distortion of this graph only, but it is also sustained when the Chimpanzee outgroup is taken into account, yielding age estimates for the autosomal divergence of our species that are several times older than that achieved by comparison of haploid lineages or justified by the archaeological record. 

So I am quite uncertain on how to read this and if errors are happening that cloud our understanding.


Are Melanesians more admixed with Denisovans? Are Native Americans less admixed with Neanderthals?

The possibility of Melanesians being slightly admixed with Denisovans is probably the most explosive aspect of the paper. Following Supplementary Information 8, the authors find some greater similitude between Melanesians and Denisovans than any other Eurasian population.

A visual explanation is in the following eigenvector graphs:

Notice that the second image is nothing but a high resolution zoom of the central clump in the first one (H. sapiens). Only at such high resolution three micro-clusters can be noticed, apparently reflecting different admixture levels with Neanderthals and Denisovans. 

To further clarify this matter, the authors resort to statistical methods that confirm these clusters and maybe add some information on several individual populations' admixture levels (not anymore just the four Eurasian populations represented above but also others). These calculations show that effectively Melanesians are slightly but significantly closer to Denisovans, while also retaining the general Neanderthal admixture of all non-Africans (or almost all). 

And I say almost all because the Karitianas (a Native American nation of Brazil) are found to have much lower Neanderthal blood than other non-Africans.

The estimates for Neanderthal admixture in Eurasians are overall of c. 3%, with the following variations:
  • Cambodian 4.4%
  • Mongolian 4%
  • Han Chinese 3.2%
  • French and Sardinians 2.6%
  • Melanesians 2.5%
  • Karitianas 0.9%
Additionally Melanesians have c. 4.8% of Denisovan genetic contribution, totaling c. 7.4% of archaic admixture.

Update (Dec 25): it may well be only 4.8% of total archaic admixture if Denisovans were hybrids of Neanderthals and H. erectus (see here - scroll to near bottom).

Note: I have a technical doubt because in table S8.2, French appear quite closer to Neanderthals than Sardinians, who seem less admixed than all other non-Africans but the Karitiana, but in table S8.3 they are given the same values of admixture. At the moment I do not understand why this difference in the values, really.

In the same table S8.2 French, Han and Cambodians (and only them) also appear to show some admixture with Denisovans, though maybe a third or fourth of that of Melanesians.


Affinities of the Denisova tooth, chronology of the Denisova cave.

In Supplementary Information 12, the authors deal with the possible paleo-anthropological affinities of the Denisova tooth (a molar), finding that it is closest in morphology to those of Australopithecus sp., H. habilis, African (but not Chinese) H. erectus and (oddly enough) Oase 2 (a H. sapiens that does not cluster with the rest of our species in this aspect).

Indonesian H. erectus is also very close if it is a second molar but not if this is a third molar. 

H. sapiens (other than Oase 2), H. neanderthalensis, Chinese H. erectus, H. georgicus (Dmansi), H. antecessor/heidelbergensis (Atapuerca) do not cluster in any case.

In this section, they also deal with the radiocarbon chronology of the site, concluding that:

... we propose the following scenario: a first hominin occupation of the cave more than 50,000 radiocarbon years ago by the Denisova hominins, and a second occupation during the Upper Palaeolithic, at 30,000 years BP or later, probably by modern humans.

Feel free to discuss.


Update (Dec 23): Denisova mtDNA "modern"?

Dienekes mentions today that Niccolo Caldararo has published an article at Nature (freely available as PDF) suggesting that the Denisova mtDNA sequence may be corrupt. If this would be true, then the sequence would be that of a H. sapiens.

This could explain some of the anomalies in the autosomal NJ tree and related age estimates, that would make Chinese and French (for instance) diverging by more than 500,000 years, what is totally absurd.

However, considering that a very similar sequence was successfully sequenced also for the tooth, this claim seems less likely.

Still many questions remain open because there are issues such as the divergence estimates for various H. sapiens, specially Eurasian H. sapiens, that just do not make any sense at all. So I'd say it's best to lay back a bit and wait patiently for more brilliant insights, which will no doubt come.


Update (Dec 25): see this new review for a more elaborate review of mine on this matter, including some intriguing hypothesis I am launching, partly on feedback provided by commenters.