Showing posts with label America. Show all posts

February 21, 2018

Caribbean Taino ancient DNA still alive in admixed populations

Taino Native Americans also had a very high genetic diversity, comparable to other continental large native populations such as Andeans or Amazonians, what speaks of high mobility in the Caribbean islands before European colonization.

The mitochondrial lineage B2 was sequenced, although it is today rare in the region.

Hannes Schroeder et al., Origins and genetic legacies of the Caribbean Taino. PNAS 2018. DOI:10.1073/pnas.1716839115

The Caribbean was one of the last parts of the Americas to be settled by humans, but how and when the islands were first occupied remains a matter of debate. Ancient DNA can help answering these questions, but the work has been hampered by poor DNA preservation. We report the genome sequence of a 1,000-year-old Lucayan Taino individual recovered from the site of Preacher’s Cave in the Bahamas. We sequenced her genome to 12.4-fold coverage and show that she is genetically most closely related to present-day Arawakan speakers from northern South America, suggesting that the ancestors of the Lucayans originated there. Further, we find no evidence for recent inbreeding or isolation in the ancient genome, suggesting that the Lucayans had a relatively large effective population size. Finally, we show that the native American components in some present-day Caribbean genomes are closely related to the ancient Taino, demonstrating an element of continuity between precontact populations and present-day Latino populations in the Caribbean.

Fig. 2.
Taino demography. Total estimated length of genomic ROH for the Taino and the Clovis genome (13) and selected Native American and Siberian genomes (15, 31, 32) in a series of length categories. ROH distributions for modern individuals have been condensed into population-level silhouettes (SI Appendix, section 14).

June 15, 2014

Mexico's Native American diversity

Interesting study on Mexico's Native American diversity:

Andrés Moreno Estrada et al., The genetics of Mexico recapitulates Native American substructure and affects biomedical traits. Science 2014. Freely available with registrationLINK [doi:10.1126/science.1251688]
Abstract

Mexico harbors great cultural and ethnic diversity, yet fine-scale patterns of human genome-wide variation from this region remain largely uncharacterized. We studied genomic variation within Mexico from over 1000 individuals representing 20 indigenous and 11 mestizo populations. We found striking genetic stratification among indigenous populations within Mexico at varying degrees of geographic isolation. Some groups were as differentiated as Europeans are from East Asians. Pre-Columbian genetic substructure is recapitulated in the indigenous ancestry of admixed mestizo individuals across the country. Furthermore, two independently phenotyped cohorts of Mexicans and Mexican Americans showed a significant association between subcontinental ancestry and lung function. Thus, accounting for fine-scale ancestry patterns is critical for medical and population genetic studies within Mexico, in Mexican-descent populations, and likely in many other populations worldwide.

Fig. 1-D
First of all it has to be highlighted that the sentence "some groups were as differentiated as Europeans are from East Asians" is a bit misleading. It refers to the raw FST parameter (Fixation Index) which in these cases is caused by extreme drift, product of isolation and small number endogamy.

Otherwise the Seris (Comcaac), who are the only population affected by the claim, are clearly derived not only from the same root as the rest of Native Americans but more specifically from the ancestor population of the Tarahumaras (Rarámuri), as fig.1-D reflects (right). 

The Seris are a small population of coastal Sonora who add up to less than one thousand people and have remained proudly distinct, not only from the colonial population but also from other fellow Native Americans. In spite of this long extreme isolation that makes the appear "as differentiated as Europeans are from East Asians", it is apparent that they must derive from the Uto-Aztecan populations of NW Mexico (and maybe also across the border). 

K=9 (fig. 2-B-part)
Other very isolated and heavily drifted populations are the Lacandon and Tojolabal Mayas. Again, in spite of their radical isolation, they seem related to other Mayas by origin. In these cases their languages are recognized as members of the Maya family, while the Seri language is considered an isolate. 

Actually the extreme FST scores only apply between these extremely drifted populations: FST{Seri-Lacandon}=0.136, FST{Seri-Tojolabal}=0.121. 

This reference is interesting because it explains how subcontinental levels of differentiation can happen in relatively short time if the founder populations are small and isolated for some 20 Ka. It is a warning call against reaching to too many conclusions based only on populations with a long history of isolation.

Otherwise the Seri FST scores are high but more normal: 0.087 to 0.096.  See table S-4 for further details. 

The tree is interesting also because it suggest a main division separating the Nahuas from the rest of the Uto-Aztecan meta-population (Saris included). The Nahuas, who approximately correspond to the the ancient Aztecs, are actually divided in several groups, which seem rather akin to their immediate neighbors and not so much among them or their linguistic relatives. 

This implies that, as the ancestors of the Nahuas migrated southwards, they assimilated so many locales that they largely lost their distinctiveness. In the ADMIXTURE graph to the left, we see that they do keep a variably small fraction of Uto-Aztecan affinity (not just them, also the Purepecha and Totonac, whose languages are distinct). 

Otherwise Mexican Natives have two main components at K=9: the main Mexican one (blue) and the Maya one (orange). The Maya division is also apparent in the tree. 

However it must be mentioned that the ADMIXTURE run available in the supp. materials (fig. S-10) reaches down to K=20, showing further differentiation between the various Mesoamerican populations dominated by the blue components at K=9. 

For comparison, in the European segment only the Basque component shows up as distinct in all those runs (since K=10). So we are talking about a fairly diverse population compared with European relative homogeneity.

Sequence of further components or distinctions showing at depths greater than K=9:
  • K=12: Tarahumara
  • K=14: Nahua-Purepecha-Totonac
  • K=15: Tepehuan
  • K=16: Purepecha + Jalisco-Nahua
  • K=18: Triqui
  • K=20 Totonac


Mestizo ancestries

An issue worth mentioning, particularly in relation to the so far unconfirmed but quite plausible Canarian origin of a large share of the "European" ancestry in the Caribbean region, is that the European ancestry of Mexicans seems essentially Iberian, as shown in fig. S-14:


I am anyhow awaiting for a sensible geneticist to address this question properly. When dealing with Mexicans and other Latin American populations of complex colonial ancestry, it seems quite apparent that so diverse European samples are in excess and that instead a North African control is surely missing instead.

A more regionalized approach to Iberian ancestry could also be interesting.

Regarding the Native American share of the ancestry, a finding of this study is that there is important regional variation: Yucatan and Campeche Mexicans have clearly strong Maya ancestry, while in Sonora it is something more like Tarahumara and in the core of Mexico it seems Nahua-like or from other "central" populations like the Zapotec or Totonac. See fig. 2A for details.

There is also very minor Tropical African ancestry across the board, somewhat more relevant in Guerrero and Veracruz, states which historically hosted the main port cities of New Spain and still have some small Afrodescendant populations.

May 18, 2014

13,000 years old Mexican remains confirm genetic continuity from Paleoamericans

New ancient mtDNA from an underwater cave in Yucatan confirmed that there are no obvious differences between the so-called Paleoamericans and modern Native Americans.

James C. Chatters et al., Late Pleistocene Human Skeleton and mtDNA Link Paleoamericans and Modern Native Americans. Science Magazine 2014. Pay per viewLINK [doi:10.1126/science.1252619]

Abstract

Because of differences in craniofacial morphology and dentition between the earliest American skeletons and modern Native Americans, separate origins have been postulated for them, despite genetic evidence to the contrary. We describe a near-complete human skeleton with an intact cranium and preserved DNA found with extinct fauna in a submerged cave on Mexico’s Yucatan Peninsula. This skeleton dates to between 13,000 and 12,000 calendar years ago and has Paleoamerican craniofacial characteristics and a Beringian-derived mitochondrial DNA (mtDNA) haplogroup (D1). Thus, the differences between Paleoamericans and Native Americans probably resulted from in situ evolution rather than separate ancestry.

The Hoyo Negro girl, whose skeleton was preserved underwater for millennia, after she apparently fell into the cave and died as consequence, belonged to haplogroup D1, one of a handful found in modern Native Americans (all them within A, B, C, D and X2). 

The radiocarbon date for the skeleton is c. 12,800 BP, while the upper limit of her death (inferred from calcite formation on the bones, dated via thermoluminiscence) is of c. 12,000 BP. 

Overall there are already four mtDNA and two Y-DNA Paleoamerican sequences from the 13-10,000 BP bracket, all of which fit perfectly with modern Native American DNA. See map to the right.

This underlines that anthropometric estimates are not really reliable to determine ancestry, at least in the long run, because there has been much speculation about these not supporting continuity between the first settlers of America (Paleoamericans) and modern Native Americans, however ancient DNA consistently supports continuity. 

One thing is the genotype and another the phenotype. And although they are somehow related for the greatest part, this relationship is not always straightforward, at least with our current knowledge.

See also: Ancient DNA from Clovis culture is Native American (also Tianyuan affinity mystery

February 16, 2014

Ancient DNA from Clovis culture is Native American (also Tianyuan affinity mystery)

Figure 4 | [c] (...) maximum likelihood tree. 
A recent study on the ancient DNA of human remains from Anzick (Montana, USA), dated to c. 12,500 calBP, confirms close ties to modern Native Americans, definitely discarding the far-fetched and outlandishly Eurocentric "Solutrean hypothesis" for the origins of Clovis culture (what pleases me greatly, I must admit).

While this fits well with the expectations (at least mine), there is some hidden data that has surprised me quite a bit: it sits at the bottom of a non-discussed formal test graph in which modern populations are compared with both Anzick and Tianyuan (c. 40,000 BP, North China). See below.

Morten Rasmussen et al., The genome of a Late Pleistocene human from a Clovis burial site in western Montana. Nature 2014. Pay per viewLINK [doi:10.1038/nature13025]

Abstract

Clovis, with its distinctive biface, blade and osseous technologies, is the oldest widespread archaeological complex defined in North America, dating from 11,100 to 10,700 14C years before present (bp) (13,000 to 12,600 calendar years bp)1, 2. Nearly 50 years of archaeological research point to the Clovis complex as having developed south of the North American ice sheets from an ancestral technology3. However, both the origins and the genetic legacy of the people who manufactured Clovis tools remain under debate. It is generally believed that these people ultimately derived from Asia and were directly related to contemporary Native Americans2. An alternative, Solutrean, hypothesis posits that the Clovis predecessors emigrated from southwestern Europe during the Last Glacial Maximum4. Here we report the genome sequence of a male infant (Anzick-1) recovered from the Anzick burial site in western Montana. The human bones date to 10,705 ± 35 14C years bp (approximately 12,707–12,556 calendar years bp) and were directly associated with Clovis tools. We sequenced the genome to an average depth of 14.4× and show that the gene flow from the Siberian Upper Palaeolithic Mal’ta population5 into Native American ancestors is also shared by the Anzick-1 individual and thus happened before 12,600 years bp. We also show that the Anzick-1 individual is more closely related to all indigenous American populations than to any other group. Our data are compatible with the hypothesis that Anzick-1 belonged to a population directly ancestral to many contemporary Native Americans. Finally, we find evidence of a deep divergence in Native American populations that predates the Anzick-1 individual.


Haploid DNA

The Y-DNA lineage of Anzick is Q1a2a1* (L54) to the exclusion of the common Native American subhaplogroup Q1a2a1a1 (M3). Among the modern compared sequences that of a Maya is the closest one.

The mtDNA belongs to the common Native American lineage D4h3a at its underived stage (root). 

For starters I must explain that these underived haplotypes can only be found within mtDNA and never in modern Y-DNA (common misconception) because this one accumulates mutations every single generation, while the much shorter mtDNA does only occasionally. Hypothetically we could find the exact ancestor of some modern Y-DNA haplogroup in ancient remains but that would be like finding the proverbial needle in the haystack. On the other hand, finding the underived stage in mtDNA, be it ancient or modern, does not mean that we are before a direct ancestor but just a non-mutated relative of her, who can be very distant in fact.


Autosomal DNA

In this aspect, the Anzick man shows clearly strongest affinities to Native Americans, followed at some distance by Siberian peoples, particularly those near the Bering Strait. 

Figure 2 | Genetic affinity of Anzick-1. a, Anzick-1 is most closely related to Native Americans. Heat map representing estimated outgroup f3-statistics for shared genetic history between the Anzick-1 individual and each of 143 contemporary human populations outside sub-Saharan Africa. (...)

However Anzick-1 shows clearly closer affinity to the aboriginal peoples of Meso, Central and South America (collectively labeled as SA) and less so to those of Canada and the American Arctic (labeled as NA). No data was available from the USA. 

This was pondered by the authors in several competing models of Native American ancestry:

Figure 3 | Simplified schematic of genetic models. Alternative models of the population history behind the closer shared ancestry of the Anzick-1 individual to Central and Southern American (SA) populations than Northern Native American (NA) populations; seemain text for further definition of populations. We find that the data are consistent with a simple tree-like model in which NA populations are historically basal to Anzick-1 and SA. We base this conclusion on two D-tests conducted on the Anzick-1 individual, NA and SA. We used Han Chinese as outgroup. a, We first tested the hypothesis that Anzick-1 is basal to both NA and SA populations using D(Han, Anzick-1; NA, SA). As in the results for each pairwise comparison between SA and NA populations (Extended Data Fig. 4), this hypothesis is rejected. b, Next, we tested D(Han, NA; Anzick-1, SA); if NA populations were a mixture of post-Anzick-1 and pre-Anzick-1 ancestry, we would expect to reject this topology. c, We found that a topology with NA populations basal to Anzick-1 and SA populations is consistent with the data. d, However, another alternative is that the Anzick-1 individual is from the time of the last common ancestral population of the Northern and Southern lineage, after which the Northern lineage received gene flow from a more basal lineage.

The most plausible model they believe is "c", in which Anzick-1 is close to the origin of the SA population, while NA diverged before him. However model "d" in which Anzick-1 is close to the overall Native American root but NA have received further inputs from a mystery population (presumably some Siberians, related to the Na-Dené and Inuit waves) is also consistent with the data. Choosing between both "consistent" models (or something in between) clearly requires further investigation. 


Tianyuan and East Asian origins

All the above is very much within expectations, although refreshingly clarifying. But there is something in the formal tests (extended data fig. 5) that is most unexpected (but not discussed in the paper). 

The formal f3 tests of ED-fig.5 a to e fall all within reasonable expectations. Maybe the most notable finding is that, after all, the pre-Inuit people of the Dorset culture (represented by the Saqqaq remains) left some legacy in Greenland, but they also show some extra affinity with several Siberian populations (notably the Naukan, Chukchi, Koryak and Yukaghir, in this order) before to any other Native Americans, including Aleuts). 

But the really striking stuff is in figs. f and g, where it becomes obvious that the Tianyuan remains of Northern China show not a tad of greater affinity to East Asians (nor to Native Americans) than to West Eurasians. Also two East Asian populations (Tujia and Oroqen) are considerably more distant than the bulk of East Asian peoples to Tianyuan but also to Aznick.

Extended Data Figure 5 | Outgroup f3-statistics contrasted for different combinations of populations. (...) f, g, Shared genetic history with Anzick-1 compared to shared genetic history with the 40,000-year-old Tianyuan individual from China.

This is very difficult to explain, more so as Tianyuan's mtDNA haplogroup B4'5 is part of the East Asian and Native American genetic pool, and the authors make no attempt to do it. 

The previous study by Qiaomei Fu et al. (open access) placed Tianyuan's autosomal DNA near the very root of Circum-Pacific populations (East Asians, Native Americans and Australasian Aborigines) but after divergence from West Eurasians:

From Qiaomei Fu 2013


They even had doubts about the position of Papuans (the only Australasian representation) in that tree, which they suspected an artifact of some sort.

Since I saw that graph (h/t to an anonymous commenter at Fennoscandian Ancestry) I am squeezing my brain trying to figure out a reasonable explanation, considering that the formal f3 test has almost certainly more weight than the ML tree made with an algorithm. 

My first tentative explanation would be to imagine a shared triple-branch origin for Tianyuan, East Asians and West Eurasians, maybe c. 60 Ka ago (it must have been before the colonization of West Eurasia), to the exclusion of other, maybe isolated, ancient populations, whose admixture with the ancestors of the Tujia, Oroqen and Melanesians (maybe via Austronesians?) causes those striking low affinity values for these.

This would be a similar mechanism to the one explaining lower Tianyuan (and generally all ancient Eurasian) affinity for Palestinians (incl. Negev Bedouins) and also the Makrani, who have some African admixture and (in the Palestinian case) also, most likely, residual inputs from the remains of the first Out-of-Africa episode in Arabia.

However to this day we have no idea of which could be those hypothetical ancient isolated populations of East Asia. In normal comparisons such as ADMIXTURE analysis the Tujia and Oroqen appear totally normal within their geographic context, but this may be an artifact of not doing enough runs to reach higher K values, according to the cross-validation test, much more likely to discern the actual realistic components. 

The matter certainly requires further research, which may well open new avenues for the understanding the genesis of Eurasian populations, particularly those from the East.

July 7, 2013

Ancient Native Americans related to modern ones

Sequencing of ancient Native American remains from British Columbia (Canada), dated to c. 5-6000 years ago, shows that many modern local natives are their apparent descendants or otherwise related.

Yinqiu Cui et al. Ancient DNA Analysis of Mid-Holocene Individuals from the Northwest Coast of North America Reveals Different Evolutionary Paths for Mitogenomes. PLoS ONE 2013. Open accessLINK [doi:10.1371/journal.pone.0066948]

Abstract

To gain a better understanding of North American population history, complete mitochondrial genomes (mitogenomes) were generated from four ancient and three living individuals of the northern Northwest Coast of North America, specifically the north coast of British Columbia, Canada, current home to the indigenous Tsimshian, Haida, and Nisga’a. The mitogenomes of all individuals were previously unknown and assigned to new sub-haplogroup designations D4h3a7, A2ag and A2ah. The analysis of mitogenomes allows for more detailed analyses of presumed ancestor–descendant relationships than sequencing only the HVSI region of the mitochondrial genome, a more traditional approach in local population studies. The results of this study provide contrasting examples of the evolution of Native American mitogenomes. Those belonging to sub-haplogroups A2ag and A2ah exhibit temporal continuity in this region for 5000 years up until the present day. Of possible associative significance is that archaeologically identified house structures in this region maintain similar characteristics for this same period of time, demonstrating cultural continuity in residence patterns. The individual dated to 6000 years before present (BP) exhibited a mitogenome belonging to sub-haplogroup D4h3a. This sub-haplogroup was earlier identified in the same general area at 10300 years BP on Prince of Wales Island, Alaska, and may have gone extinct, as it has not been observed in any living individuals of the Northwest Coast. The presented case studies demonstrate the different evolutionary paths of mitogenomes over time on the Northwest Coast.

Figure 2. Phylogeny of complete mitochondrial genomes sequenced in this study.
Mutations are transitions unless specified. Transversions are indicated by an A, G, C, or T after the nucleotide position. Insertions are indicated by an “i”, deletions are indicated by a “d”, recurrent mutations are underlined, and mutations back to the rCRS nucleotide are designated by a “@”. The C stretch length polymorphism in region 303–315 was disregarded in the tree. The sample “Haida 9″ was analyzed in Schurr et al. (2012). All other samples were analyzed in this study.

June 22, 2013

New Maya city discovered

Archaeologists have discovered the ruins of a long lost Maya city in the jungle SE of Campeche state (Yucatan Peninsula, Mexico), in the historical Maya region of the central lowlands. 


The newly discovered city, Chaktún, occupies some 22 Ha. and is believed to have been an important local power between 600 and 900 CE. It was hidden in the northern area of the Biosphere Reserve of Calakmul, near the Guatemalan border.

Source: Paleorama[es].

May 17, 2013

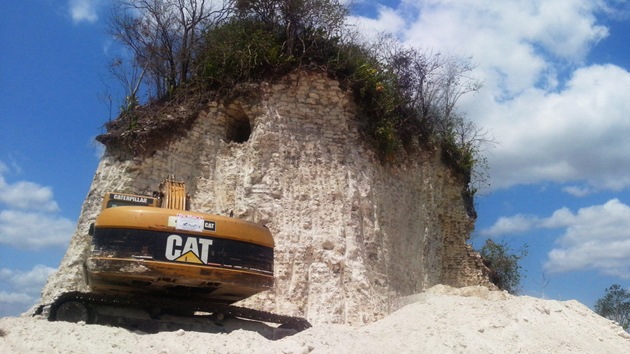
Maya pyramid destroyed in Belize... to get gravel

The machinery of a construction company has destroyed one of the most important archaeological treasures of Belize with the most idiotic possible purpose: to get gravel from it. 


The pyramid of Nohmul was erected some 2300 years ago and are part of the most important patrimonial set of Belize, located not far from the Mexican border. 

Belizean police claims to be investigating the incident and may lay charges against the vandals.

April 22, 2013

OSL dating: Brazilian site is 22,000 years ago

Toca da Tira Peia is the new name of American prehistory, providing an OSL date for the layer of scattered stone tools of c. 22,000 years BP. Located near the also controversial Pedra Furada site, the date seems to give some support to those who dare to think outside the box on the early peopling of America.

Christelle Lahaye et al., Human occupation in South America by 20,000 BC: the Toca da Tira Peia site, Piauí, Brazil. Science 2013. Pay per view LINK [doi:10.1016/j.jas.2013.02.019]

Abstract

When and how did the first human beings settle in the American continent? Numerous data, from archaeological researches as well as from palaeogenetics, anthropological and environmental studies, have led to partially contradictory interpretations in recent years, often because of the lack of a reliable chronological framework. The present study contributes to the establishment of such a framework using luminescence techniques to date a Brazilian archaeological site, the Toca da Tira Peia. It constitutes an exemplary case study: all our observations and measurements tend to prove the good integrity of the site and the anthropological nature of the artifacts and we are confident in the accuracy of the luminescence dating results. All these points underline the importance of the Toca da Tira Peia. The results bring new pieces of evidence of a human presence in the north-east of Brazil as early as 20,000 BC. The Toca da Tira Peia thus contributes to the rewriting of the history of the peopling of the American continent.

There are slightly older sites in North America, however they are all surrounded into some degree of controversy: Topper in South Carolina is dated to c. 23,000 cal-BP (C14) while some sites in Alberta, located in the Mackenzie "ice-free corridor" have also dates under the LGM layer (i.e. > 21 Ka BP).

There's actually nothing impossible about such early dates in my understanding.

See also:

April 14, 2013

Southern Native American Y-DNA: no correlation with language, extensive info on haplogroup C3

Genetics does not necessarily correlate with linguistic families. It often does not. This seems to be the case with Native Americans as well.

Lutz Roewer et al., Continent-Wide Decoupling of Y-Chromosomal Genetic Variation from Language and Geography in Native South Americans. PLoS Genetics 2013. Open accessLINK [doi:10.1371/journal.pgen.1003460]

Abstract

Numerous studies of human populations in Europe and Asia have revealed a concordance between their extant genetic structure and the prevailing regional pattern of geography and language. For native South Americans, however, such evidence has been lacking so far. Therefore, we examined the relationship between Y-chromosomal genotype on the one hand, and male geographic origin and linguistic affiliation on the other, in the largest study of South American natives to date in terms of sampled individuals and populations. A total of 1,011 individuals, representing 50 tribal populations from 81 settlements, were genotyped for up to 17 short tandem repeat (STR) markers and 16 single nucleotide polymorphisms (Y-SNPs), the latter resolving phylogenetic lineages Q and C. Virtually no structure became apparent for the extant Y-chromosomal genetic variation of South American males that could sensibly be related to their inter-tribal geographic and linguistic relationships. This continent-wide decoupling is consistent with a rapid peopling of the continent followed by long periods of isolation in small groups. Furthermore, for the first time, we identified a distinct geographical cluster of Y-SNP lineages C-M217 (C3*) in South America. Such haplotypes are virtually absent from North and Central America, but occur at high frequency in Asia. Together with the locally confined Y-STR autocorrelation observed in our study as a whole, the available data therefore suggest a late introduction of C3* into South America no more than 6,000 years ago, perhaps via coastal or trans-Pacific routes. Extensive simulations revealed that the observed lack of haplogroup C3* among extant North and Central American natives is only compatible with low levels of migration between the ancestor populations of C3* carriers and non-carriers. In summary, our data highlight the fact that a pronounced correlation between genetic and geographic/cultural structure can only be expected under very specific conditions, most of which are likely not to have been met by the ancestors of native South Americans.


There's only so much to say about language families and patrilineages: that they do not agree in any obvious way:

Table 1. Correlation between Y-SNP haplogroup and language class.


However the paper also address the interesting matter of NE Asian and Native American paragroup C3(xC3b), which is almost only found among Ecuadorean Natives (Kichwa and Waorani speakers). The only other known case among Native Americans, according to the authors, is an individual of Southern Alaskan native ancestry. 


Figure 1. Origin of male native South American samples.
For each sampling site, its geographic location as well as the size (proportional to the circle area) and Y-SNP haplogroup composition of the respective sample are shown. Blue lines: major aquatic systems; dashed gray lines: current national boundaries.


Overall distribution of Y-DNA C3* (yellow), which I understand to mean C3(xC3b) for this study:


Figure 4. Prevalence of Y-SNP haplogroup C-M217 (C3*) around the Pacific Ocean.
Light blue: previous studies; dark blue: present study; yellow: relative frequency of C-M217 (C3*) carriers.

The most interesting information anyhow may be in the haplotype network:


Figure 5. Median-joining network of 167 different Asian and American Y-STR haplotypes carrying Y-SNP haplogroup C3* (from this and previously published studies).
The median-joining network is based upon markers DYS19, DYS389I, DYS389II-DYS389I, DYS390, DYS391, DYS392, DYS393 and DYS439 (see Materials and Methods for details). ALA: Alaskan; KOR: Korean; CHI: Chinese, including Daur, Uygur, Manchu; MON: Mongolian, including Kalmyk, Tuva, Buryat; ANA: Anatolian; INDO: Vietnamese, Thai, Malaysian, Indonesian, Philippines; JAP: Japanese; TIB: Tibetan, Nepalese; ALT: Altaian, including Kazakh, Uzbek; SIB: Teleut, Khamnigan, Evenk, Koryak; ECU: Ecuadorian, including Waorani, Lowland Kichwa, COL: Colombia, including Wayuu; RUS: Russian.

The network clearly shows that the Native American C3* haplotypes are mostly or totally related to a cluster of Altaian, Mongol and Chinese roots. The Altaian connection is particularly strong for all but one of the lineages. This is very much concordant with a proto-Amerind patrilineal origin in Altai (where NE Asian and American Y-DNA Q and mtDNA X2 variants surely originated in the early Upper Paleolithic) which traveled to Beringia via Mongolia or nearby regions, spreading the mode 4 (blade tech) to East Asia c. 30,000 years ago.

This is not the view of the authors but mine. The authors instead speculate with (i) a late wave or (ii) even naval contact between East Asia and South America. I find both hypothesis lacking merit and I lean for a founder effect model instead.

On the other hand, the C3b presence in NW North America, critically among Na-Dene speakers, may still represent a second wave: that of Na-Dene speakers, whose "recent" linguistic connections to Siberia (Yenisean family) have found strong support in the last years. 

April 13, 2013

Rock art from Baja California dates to c. 9,000 years ago, maybe even older

Catalan researchers from the IPHES have been studying the impressive rock art of the caves of Baja California Sur (Mexico) and concluded that some of the art is from c. 8-9,000 years ago. However contextual dates are sometimes older, of c. 10-11,000 years ago. 

Source: El Universal[es], which has many more photos.


For decades it was believed, following the pioneer work of Clement Meighan, that the art was from the 13th century CE. However in the 1980s the more in-depth research by Catalan scientists revealed that it is in fact from much older dates, at least 5,000 years ago. These days it has been revealed that they are even older in some cases. 

The rock art is distributed by many areas of Baja California Sur, very especially the Sierra de San Francisco, which alone hosts more than 250 sites. These sites were often occupied through millennia, until the 18th century CE in some cases. Even later they have been used as shelters for sheep, however nowadays they do enjoy state and UNESCO protection. 

The most outstanding cave, La Pintada (the painted one), appears to have indications of astronomical knowledge. In the words of Viñas Vallverdú:

In the particular case of La Pintada there are many markings of astronomical type, spots where it is indicated that the Sun illuminates in certain time of the year, signaling a date in their calendar. That way they knew that, when the Sun hit one of those marks, it was time to collect the pitahaya or that the rain period was nearing.

The research is part of an international project by IPHES and the Instituto Nacional de Antropología e Historia (INAH) of Mexico, which is surveying the prehistory of the North American federation. 

The study will be published as the doctoral thesis of lead researcher Ramón Viñas Vallverdú (IPHES).

Source: El Universal[es] (includes a very beautiful photo-gallery).

February 13, 2013

5000 years old temple found near Lima, Peru

Archaeologists have uncovered one of the oldest temples of America in El Paraíso, a rich archaeological site located 40 km northwest of Lima. 

The pyramidal structure is estimated to be c. 5000 years old (although awaiting radiocarbon dating), much much older than the Incas and rather contemporary of the pyramids of Egypt, for example. It confirms that the area of Lima was a ceremonial center for the ancient peoples of Peru.

The Temple of Fire, as it was nicknamed by the discoverers, contains a hearth at its center, which they suspect was a key part of their rituals. It is built of stone covered in fine yellow clay, which shows some indications of having been painted in red colors.

The ritual site is located close both to the coast and to the valley, allowing for it to interact with both the coastal fishing economy and the beginnings of agriculture in the interior, they say. The prehistorical period of this building is known as the Pre-Ceramic Age (c. 3600-1800 BCE). 

Sources: BBC, El Universo[es] (via Pileta).


Update: see the interesting comments below by Raimo Kangasniemi, who argues that several sites (Áspero, La Galgada, Caral, all them in Peru) are roughly contemporary of this one, indicating a growing dedication of resources to ritual/religious buildings already in the Pre-Ceramic Period V, also elsewhere.

January 31, 2013

Native American gigantic mound was built in just 90 days

Map of the earthworks
The Poverty Point earthworks (Louisiana, USA), are a very large construction dated to c. 3200 years ago. Among the various parts of the impressive complex is Bird Mound, which spans 50,000 square meters and needed almost 300,000 cubic meters of earth to be built. 

This huge task was previously thought to have been accomplished in a long time, however new research of the layers indicates the opposite: that it was finished in just three months, what apparently required thousands of people passing baskets of earth in "bucket brigade" style.

"Given that a band of 25-30 people is considered quite large for most hunter-gatherer communities, it's truly amazing that this ancient society could bring together a group of nearly 10,000 people, find some way to feed them and get this mound built in a matter of months," Kidder says.

One caveat is that they surely were not "hunter-gatherers" but at least part-time farmers but it is still an impressive feat.

Source: Eureka Alert (via Pileta). 

January 1, 2013

Native American archaeological findings

Stone Pages' Archaeonews includes in its latest newsletter a number of interesting references to new findings on Native American Prehistory:


The Morehead Circle (Ohio)

This ritual enclosure of the intriguing Hopewell culture, which is being dug now, is dealt in detail at Ohio Archaeology Blog → link 1, link 2.


Pig Point funerary rituals (Maryland)

These would be part of the Adena culture, precursor of Hopewell, and this site in coastal Maryland has yielded not just evidence of them but layers and layers of associated artifacts, with the oldest being as early as 10,000 BP (most are from 5000 to 1000 BP however).

Early Native American tribes engaged in reburial rituals. Every year, 10 years, or more, a group would gather the remains of their dead and commit them to a common burial ground.

Iroquois tribes were noted for their reburial rituals as were the Nanticoke who took their ancestors’ remains with them when they moved to Pennsylvania from the Eastern Shore.

Ossuaries held the the dead whether nothing but skeleton or fresher remains. But the bodies were intact, or mostly so. The difference at Pig Point is that all the bones were smashed, broken on purpose. And so were thousands of artifacts such as fancy Adena points, beads, gorgets, and other items. All broken into bits.


Ohio calumets reveal wide exchange networks

The site of Tremper Mound (Ohio) has been known for a century now but it was assumed that the many pipes found there were carved from local stone. That has been now demonstrated to be mostly wrong: only less than 20% of the pipes were made from local materials, instead 65% were carved in flint clay from Northern Illinois and 18% in catlinite from Minnesota.


4000 years old weapons from Sinaloa

50 km north of Mazatlan (Sinaloa, Mexico) lays the rock art  site of Las Labradas. Not far from there, at La Flor del Océano, archaeologists have now discovered spearheads, knives and other tools made of stone. 

Fox News.

December 19, 2012

Alert: Brazilian mining project to destroy dozens of archaeological sites in the Amazon

At least 24 caves, which hold major archaeological relevance for the understanding of the early inhabitation of the Amazon basin, will be destroyed by a gigantic iron mine project in the region of Carajás (Pará, Brazil). 

While the area is a national forest and the Brazilian law demands in principle that archaeological sites be preserved, the government has given Vale, the Brazilian mining giant, what amounts to a blank license for the destruction of whatever stands in their way.

Not just that, but Vale holds control over what ongoing research can disclose of the importance of the caves:

Renato Kipnis, a respected archaeologist in São Paulo whom Vale hired to survey the caves of Carajás, said that Vale had prohibited him from discussing their archaeological significance, because of a confidentiality agreement Vale had required him to sign. Later, a Vale spokeswoman allowed Mr. Kipnis to be interviewed by e-mail, but only if the company was allowed to vet his replies. 

In written replies screened by Vale, he marveled at the importance of the caves. 

Source: New York Times

NASA image of the already existing Carajás mine

November 5, 2012

12,000 years old human presence in Costa Rica

An early Native American site in the Reventazón river (Costa Rica) has been dated by radiocarbon to c. 12,000 years BP. 

The date is consistent with others in North America (as old as c. 17,000 BP) and South America (c. 13,000 BP) marking the likely first inhabitation of the Western Hemisphere. It is anyhow the oldest prehistoric date known for Costa Rica.

The site which is being dug prior to the completion of a hydroelectric project, has been researched for several years now and has provided stone tools and weapons, as well as some charcoal (fire residues) that have allowed to date it.

Source: Pileta de Prehistoria[es].

November 1, 2012

Genetic insights on tomato origins

Who doesn't love tomato? Well, my dad. But besides him... 

But one thing is loving tomato sauce, tomato salad, tomato in sandwich or other tomato based cuisine and another thing is to know much about its origins. 

While it is generally accepted that Europeans brought tomato from Mexico, the species has its greatest diversity in the Andean region. This new study should help us to better understand the nuances of tomato origins:

José Blanca et al., Variation Revealed by SNP Genotyping and Morphology Provides Insight into the Origin of the Tomato. PLoS ONE, 2012. Open access ··> LINK [doi:10.1371/journal.pone.0048198]

Abstract

Tomato, Solanum lycopersicum, is divided into two widely distributed varieties: the cultivated S. lycopersicum var. lycopersicum, and the weedy S. lycopersicum var. cerasiforme. Solanum pimpinellifolium is the most closely related wild species of tomato.

The roles of S. pimpinellifolium and S. l. cerasiforme during the domestication of tomato are still under debate. Some authors consider S. l. cerasiforme to be the ancestor, whereas others think that S. l. cerasiforme is an admixture of S. pimpinellifolium and the cultivated S. l. lycopersicum. It is also not clear whether the domestication occurred in the Andean region or in Mesoamerica. We characterized 272 accessions (63 S. pimpinellifolium, 106 S. l. cerasiforme, 95 S. l. lycopersicum and 8 derived from hybridization processes) were morphologically and genetically using the SolCap platform (7,414 SNPs). The two species were distinguished in a PCA analysis and displayed a rich geographic structure. Solanum lycopersicum var. cerasiforme and S. l. lycopersicum were also differentiated in the PCA and Structure analyses, which supports maintaining them as different varieties. Solanum pimpinellifolium and the Andean S. l. cerasiforme were more diverse than the non-Andean S. lycopersicum. Solanum lycopersicum var. cerasiforme was morphologically and molecularly intermediate between S. pimpinellifolium and tomato. Solanum lycopersicum var. cerasiforme, with the exception of several Ecuadorian and Mexican accessions, is composed of the products of admixture processes according to the Structure analysis. The non-admixtured S. l. cerasiforme might be similar to the ancestral cultivars from which the cultivated tomato originated, and presents remarkable morphological diversity, including fruits of up to 6 cm in diameter. The data obtained would fit a model in which a pre-domestication took place in the Andean region, with the domestication being completed in Mesoamerica. Subsequently, the Spaniards took plants from Mesoamerica to Spain and from there they were exported to the rest of the world.

Fig. 2A (with legend from fig. 1) - PCA analysis of the S. lycopersicum samples

September 20, 2012

Younger Dryas meteorite impact theory consolidated

The revealing micro-spherules
After sometimes heated debates, it seems that the theory of a meteorite impacting on Earth, probably above Canada, at the beginnings of the Younger Dryas and probably related to megafauna extinctions seems to be gaining more and more weight.

Malcom A. LeCompte et al. Independent evaluation of conflicting microspherule results from different investigations of the Younger Dryas impact hypothesis. PNAS 2012. Pay per view (for 6 months/depending on world region) ··> LINK [doi]

Abstract

Firestone et al. sampled sedimentary sequences at many sites across North America, Europe, and Asia [Firestone RB, et al. (2007) Proc Natl Acad Sci USA 106:16016–16021]. In sediments dated to the Younger Dryas onset or Boundary (YDB) approximately 12,900 calendar years ago, Firestone et al. reported discovery of markers, including nanodiamonds, aciniform soot, high-temperature melt-glass, and magnetic microspherules attributed to cosmic impacts/airbursts. The microspherules were explained as either cosmic material ablation or terrestrial ejecta from a hypothesized North American impact that initiated the abrupt Younger Dryas cooling, contributed to megafaunal extinctions, and triggered human cultural shifts and population declines. A number of independent groups have confirmed the presence of YDB spherules, but two have not. One of them [Surovell TA, et al. (2009) Proc Natl Acad Sci USA 104:18155–18158] collected and analyzed samples from seven YDB sites, purportedly using the same protocol as Firestone et al., but did not find a single spherule in YDB sediments at two previously reported sites. To examine this discrepancy, we conducted an independent blind investigation of two sites common to both studies, and a third site investigated only by Surovell et al. We found abundant YDB microspherules at all three widely separated sites consistent with the results of Firestone et al. and conclude that the analytical protocol employed by Surovell et al. deviated significantly from that of Firestone et al. Morphological and geochemical analyses of YDB spherules suggest they are not cosmic, volcanic, authigenic, or anthropogenic in origin. Instead, they appear to have formed from abrupt melting and quenching of terrestrial materials.

Most interesting in this research is that it was done directly at an archaeological layer of the Clovis clulture, what makes the chronology very solid.

Also the authors claim that some of the negative reports did not follow the protocol to detect the spherules and that is why they missed them, stirring controversy.

Partial source: Science Daily.

See also for background (this blog and its predecessor in reverse chronological order):

August 11, 2012

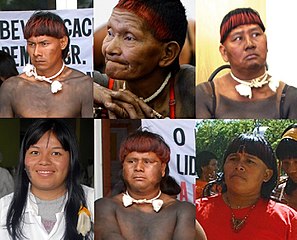
The Xavantes as genuine unmixed Native Americans

Xavantes (cc Agência Brasil)
A new paper proclaims that Xavantes appear to be one of the less mixed and or more genetically distinctive Native American people of present day.

Patricia C. Kuhn et al., Genome-Wide Analysis in Brazilian Xavante Indians Reveals Low Degree of Admixture. PLoS ONE 2012. Open access ··> LINK [doi: 10.1371/journal.pone.0042702]

Abstract

Characterization of population genetic variation and structure can be used as tools for research in human genetics and population isolates are of great interest. The aim of the present study was to characterize the genetic structure of Xavante Indians and compare it with other populations. The Xavante, an indigenous population living in Brazilian Central Plateau, is one of the largest native groups in Brazil. A subset of 53 unrelated subjects was selected from the initial sample of 300 Xavante Indians. Using 86,197 markers, Xavante were compared with all populations of HapMap Phase III and HGDP-CEPH projects and with a Southeast Brazilian population sample to establish its population structure. Principal Components Analysis showed that the Xavante Indians are concentrated in the Amerindian axis near other populations of known Amerindian ancestry such as Karitiana, Pima, Surui and Maya and a low degree of genetic admixture was observed. This is consistent with the historical records of bottlenecks experience and cultural isolation. By calculating pair-wise Fst statistics we characterized the genetic differentiation between Xavante Indians and representative populations of the HapMap and from HGDP-CEPH project. We found that the genetic differentiation between Xavante Indians and populations of Ameridian, Asian, European, and African ancestry increased progressively. Our results indicate that the Xavante is a population that remained genetically isolated over the past decades and can offer advantages for genome-wide mapping studies of inherited disorders.

The Xavantes, comprising today some 10,000 people, have suffered repeated hostility from the Western civilization in Brazil since centuries ago. In spite of all they have managed to remain proud and distinct.

Fig. 2 three-dimensional global PCA with emphasis in American populations

Fig. 3 (edited by me: only the labeling): neighbor-joining global tree

July 26, 2012

Ancient DNA... of chickens

Sure, why not?

Alice A. Storey, Investigating the Global Dispersal of Chickens in Prehistory Using Ancient Mitochondrial DNA Signatures. PLoS ONE, 2012. Open access ··> LINK [DOI: 10.1371/journal.pone.0039171]

The authors managed to produce more or less reliable mtDNA haplotypes for 48 remains of historical and prehistorical chickens from Thailand, Pacific Islands, Latin America (a pre-Columbian site in Chile but post-Columbian sites elsewhere) and (medieval) Spain.

Excepting the oldest Thai haplotype, all them belonged to haplogroups D and E, as follows:

Fig. 1
In spite of the authors burying most of the relevant data in the supplemental material, I was able to conclude that the ancient haplotypes (ah) above mean in terms of samples:

  • Haplogroup E:
    • cluster 1:
      • ah1 Pacific Is. (n=1)
      • ah2 Pacific Is. (n=4), Thailand (n=1), Chile (n=1)
      • ah6 Peru (n=1)
    • cluster 2:
      • ah3 Pacific Is. (n=10), Chile (n=2), Spain (n=3), Haiti (n=1), Florida (n=1)
      • ah4 Spain (n=1)
      • ah5 Bolivia (n=3)
      • ah7 Spain (n=1)
  • Haplogroup D:
      • ah9 Pacific Is. (n=1), Peru (n=1)
    • cluster 3:
      • ah10 Pacific Is. (n=14)
      • ah11 Pacific Is. (n=1)
  • Haplogroup B (not shown):
      • ah12 Thailand (n=1)
There is no ah8 apparently. 

It must be noted that the ah9 haplotype from Peru is very early post-Columbian, from before 1600 CE, making it another likely evidence of Polynesian introduction of chicken in South America, along with the Chilean sites (which allow for no other explanation). However the Peruvian haplotype is more related to Micronesia than to Hawaii or Rapa Nui.

Other 17th century samples from Bolivia and Peru (ah5 and ah6) have no obvious connection with either plausible origin. Instead Caribbean sites are probably related to Spain.

A simplified geographical distribution is also offered (oddly enough on a pre-WWI map):

Fig. 2

The authors conclude:

As a result of the careful analysis of archaeologically associated, and in some cases directly dated, ancient DNA samples an early global distribution of haplogroup E chickens has been revealed. This dispersal out of Asia began before 3000 years ago and involved the movement of chickens both westwards to Europe and eastwards into the Pacific. The distribution of haplogroup D likely represents a separate dispersal into the Pacific from a distinct Asian domestication centre. The eventual identification of these centers will greatly enrich our understanding of chicken domestication and the history of dispersals from multiple locations. While unambiguous data does not yet exist to trace any of the detected mtDNA signatures back to specific domestication centers, the analysis of ancient DNA sequences presented here is an important first step towards it. Future research needs to focus on markers identified, from both full mtDNA genomes and nuclear genes which are subsequently targeted in ancient specimens, examined within their historical and/or archaeological context.

June 29, 2012

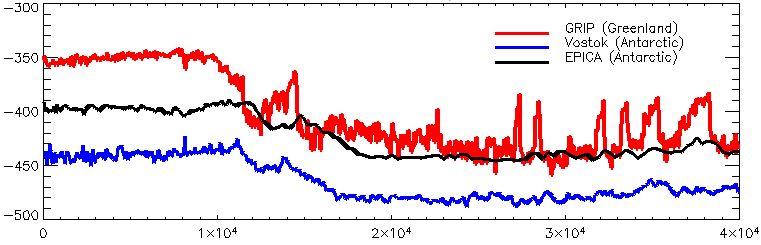
Reliability of Greenland ice cores questioned for Younger Dryas only

It seems now that the main proxy to understand Northern Hemisphere glaciation, the Greenland ice cores, is not as straightforward as scientists used to think. At least that is what a new study claims in relation to the Younger Dryas (only):

Zhengyu Liu, Younger Dryas cooling and the Greenland climate response to CO2. PNAS 2012. Pay per view (6-month embargo or depending on world region).


Abstract

Greenland ice-core δ18O-temperature reconstructions suggest a dramatic cooling during the Younger Dryas (YD; 12.9–11.7 ka), with temperatures being as cold as the earlier Oldest Dryas (OD; 18.0–14.6 ka) despite an approximately 50 ppm rise in atmospheric CO2. Such YD cooling implies a muted Greenland climate response to atmospheric CO2, contrary to physical predictions of an enhanced high-latitude response to future increases in CO2. Here we show that North Atlantic sea surface temperature reconstructions as well as transient climate model simulations suggest that the YD over Greenland should be substantially warmer than the OD by approximately 5 °C in response to increased atmospheric CO2. Additional experiments with an isotope-enabled model suggest that the apparent YD temperature reconstruction derived from the ice-core δ18O record is likely an artifact of an altered temperature-δ18O relationship due to changing deglacial atmospheric circulation. Our results thus suggest that Greenland climate was warmer during the YD relative to the OD in response to rising atmospheric CO2, consistent with sea surface temperature reconstructions and physical predictions, and has a sensitivity approximately twice that found in climate models for current climate due to an enhanced albedo feedback during the last deglaciation.

The problem is that, when compared with other records, the Greenland Ice cores' oxygen isotope ration does not hold. The explanation is complex and related to CO2 levels, the North American Ice Sheet (which was already in retreat) and the different composition of oxygen isotopes when they arrived from the Pacific Ocean.

From the Archaeology News Network:

Working with UW-Madison climatologist Zhengyu Liu, collaborators at the National Center for Atmospheric Research and others, Carlson found their computer climate model breaking down on the Younger Dryas.

While it could reliably recreate temperatures in the Oldest Dryas -- a similar cooling period about 18,000 years ago -- they just couldn't find a lever in the model that would simulate a Younger Dryas that matched the Greenland ice cores.

"You can totally turn off ocean circulation, have Arctic sea ice advance all the way across the North Atlantic, and you still will have a warmer climate during the Younger Dryas than the Oldest Dryas because of the carbon dioxide," Carlson says.

By the time the Younger Dryas rolled around, there was more carbon dioxide in the air -- about 50 parts per million more. The warming effects of that much CO2 overwhelmed the rest of the conditions that make the Oldest and Younger Dryas so alike, and demonstrates a heightened sensitivity for Arctic temperatures to rising greenhouse gases in the atmosphere.

The researchers zeroed in on the Northern Hemisphere's temperature outlier, Greenland ice cores, and found that the conversion of oxygen isotope ratio to temperature typically used on the ice cores did not account for the sort of crash climate change occurring during the Younger Dryas. It assumes prevailing winds and jet streams and storm tracks are providing the moisture for Greenland precipitation from the Atlantic Ocean.

"The Laurentide ice sheet, which covered much of North America down into the northern United States, is getting smaller as the Younger Dryas approaches," Carlson says. "That's like taking out a mountain of ice three kilometers high. As that melts, it allows more Pacific Ocean moisture to cross the continent and hit the Greenland ice sheet." The two oceans have distinctly different ratios of oxygen isotopes, allowing for a different isotope ratio where the water falls as snow.

Hat tip: Pileta.

Some temperature proxies for the Younger Dryas