This new study has particular interest for data miners willing to dig in the supplemental materials. It also has some other points of interest that I will discuss below and its general approach is loosely alright. However there are many nuances to be discussed in depth on the very complex NW African genetic landscape in which their tentative conclusions seem to lack enough depth of analysis (who grabs too much, squeezes little). Hence the complexity is too big for me to go issue by issue offering a criticism, so I will leave most of that open for the discussion, if the readers wish so.
Asmadan Bekada et al., Introducing the Algerian Mitochondrial DNA and Y-Chromosome Profiles into the North African Landscape. PLoS ONE 2013. Open access → LINK [doi:10.1371/journal.pone.0056775]
Mitochondrial DNA
The mtDNA landscape of Algeria and Northwest Africa is dominated (using HVS-I only to estimate it) by R-CRS ("H/HV" in table S2) with levels of 18-34% (29% in Algeria) almost comparable to Western Europe (~45%). This fraction
we know from
previous studies to be composed almost only by H1, H3, H4 and H7, all them
attributed by Cherni to be originated (judging on diversity) in SW Europe (Iberia, France). Along with them HV0/V (7% in Algeria, 5-9% regionally) must be mentioned as also plausibly to be from that part of Europe (4-7%).
Another notable lineage is U6 (typical and most diverse in NW Africa), which reaches frequencies of 11% in Algeria (somewhat less in neighboring countries). Outside this area is only notable in Levant (~1%) and Iberia (~1,4%).
M1 reaching 7% in Algeria (~1-4% elsewhere in NW Africa, <1% in Europe and Highland West Asia, 1.2% in Levant, 2.4% in Peninsular Arabia) is also very much worth a mention, especially because the authors find an specifically NW African node centered in Algeria (HT2):
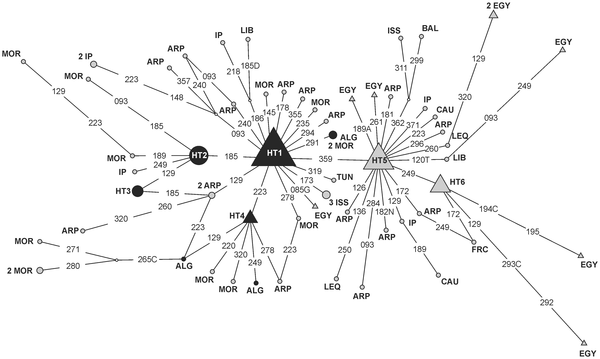 |
Figure 3. Reduced median network relating HVS-1 sequences of subhaplogroup M1.
(...) Black circles correspond to haplotypes observed in Algeria, whereas grey triangles pentagons correspond to lineages found in Egypt. Haplotype observed both in Algeria and Egypt are indicated using a black triangle. Grey circles indicate haplotypes observed in other geographical regions. (...) |
The pattern suggests an Egypt-centered expansion for this lineage, however notice that East African M1 was not considered.
Synthesis of mtDNA haplogroups or paragroups found in NW Africa at frequencies >2.5% (see table S2 for details and the many low frequency lineages as well), nomenclature as in table S2 (but some annotations in [square brackets] by me), frequencies for Algeria first (in brackets NW African range):
- HV/H[R-CRS]: 28.8% (17.9-34.2%)
- HV0/HV0a/V: 6.7% (4.6-8.3%)
- R0a: 0.8% (0.8-3.2%)
- U3*: 3.2% (1.1-3.2%)
- U6a[U6a*]: 1.9% (1.9-7.8%)
- U6a1'2'3: 9.4% (2.6-9.4%)
- K*: 1.6% (0.7-4.8%)
- T1a: 3.5% (0.0-5.6%)
- T2b*: 1.9% (0.0-2.2%)
- J[*]/J1c/J2[*]: 3.8% (1.3-3.8%)
- M1[*]: 7.3% (0.7-7.3%)
- L3b[*]: 0.3% (0.3-2.8%)
- L3b1a3: 1.3% (0.0-2.8%)
- L3e5: 1.6% (0.0-2.9%)
- L2*: 0.5% (0.0-4.1%)
- L2a[*]: 0.8% (0.0-3.2%)
- L2a1*: 1.3% (0.7-4.8%)
- L2a1b: 1.3% (0.8-3.5%)
- L2d: 0.0% (0.0-2.8%)
- L1b*: 3.0% (2.7%-9.0%)
Notice that in nearly all cases L(xM,N) highest frequency correspond to West Sahara. The exceptions are L2a* (Tunsian "Andalusians") and L3e5 (Tunisians), suggesting maybe a local NW African deep rooting rather than ancient or recent flows from Tropical Africa. There are other lineages in the low frequency range in similar situation.
For this and other reasons I decided to color-code the list above according to my best guess about the origin of each lineage:
NW African in deep red,
Tropical African in brown,
Egyptian in light brown,
West Asian in green and
European in blue. Unclear cases I left in black type.
Mini-update (Apr 19 2015): my rough estimate of ancient regional origins of Egyptian mtDNA (Notice that
European lineages can be as ancient in North Africa as Oranian, c. 22 Ka ago):
- Ancient North African: 13.7%
- European: 35.5%
- West Asian: 14.8 (includes those labeled above as unclear)
- Tropical African: 7.7%
- Egyptian: 7.3%
- Low frequency lineages (not classified): 23%
(End of mini-update for mtDNA)
Y chromosome DNA
Algerian and NW African Y-DNA is overwhelmingly dominated by E1b1b1b (M81), reaching 44% in Algeria (44-67% in the region), which is a NW African specific lineage. The second most important lineage by frequency is J1 (M304) with 22% in Algeria (0-22% in the region, 6-22% if we exclude Libya). None of the rest of the lineages reaches 7%, excepted E1b1b1c (M123) but only in West Sahara (11%, elsewhere it is very minor).
List of Y-DNA haplo-/paragroups with frequencies above 2.5% anywhere in NW Africa follows (based on table S6). Same notation as with mtDNA (Algerian frequency first, NW African range in brackets):
- E1a (M33): 0.6% (0.0-5.3%)
- E1b1[*] (P2): 5.2% (0.7-38.6%)
- E1b1b1[*] (M35): 0.6% (0.0-4.2%)
- E1b1b1a4 (V65): 1.9% (0.0-4.8%)
- E1b1b1b (M81): 44.2% (44.2-67.4%)
- E1b1b1c (M123): 1.3% (0.0-11.1%)
- F[*] (M89): 3.9% (0.0-3.9%)
- J1 (M267): 21.8% (0.0-21.8%)
- J2a2 (M67): 3.9% (0.0-3.9%)
- R1b1a (V88): 2.6% (0.9-6.9%)
- R1b1b1a1b[*] (U198): 2.6% (0.0-2.6%)
- R1b1b1a1b1 (U152): 2.6% (0.0-2.6%)
Mini-update (Apr 19 2015): I color coded the Y-DNA above also by origin, same as with mtDNA, except that here
light brown does not mean "Egypt" but
"Nile basin" or "NE Africa", including Sudan and Ethiopia. I find easier to discern regionally that way with Y-DNA than with mtDNA. I consider the bulk of J1 (see below) and of R1b-V88 to have that origin but I
can't discard minor J1 from more recent West Asian inflows nor some
R1b-V88 arriving from Chadic peoples across the Sahara or Mediterranean origins (both lineages demand more detailed and dedicated research).
NW African E1b sublineages are related to these Nile Basin ones but it's unclear how old they are in the region (I would say that E1b-M81 particularly is very old but not quite sure how much exactly). Totals by regional origin:
- NW Africa: 46.1%
- NE Africa: 31.5%
- European: 5.2%
- West African: 0.6%
- Unclear (F*): 3.9%
- Low frequency lineages (not classified): 12.7%
(End of mini-update for Y-DNA)
For more diverse samples of NW African Y-DNA (from previous studies), Wikipedia has
a nice table.
I would like to highlight the problematic of J1 in Africa in general (including NW Africa). While there is no reasonable doubt that J1 as a whole originated in West Asia, it is found at rather high frequencies in East/NE Africa (Sudan, the Horn, Upper Egypt) and NW Africa with only very limited (at best) company by J2. Instead West Asian populations show a much more balanced apportion of the two major J sublineages, even
in Saudi Arabia the J1:J2 proportion is of 8:3, almost 2:1. We do see this kind of apportioning in Lower Egypt, suggesting a "recent" (Neolithic or later) demic colonization from West Asia but we see exactly but nowhere else in Africa, where J1 is found always much more frequently than J2 (if the latter is found at all).
In my understanding this excludes colonization from West Asia after the
Pre-Pottery Neolithic B, which seems the most plausible scenario for the spread of "Highlander" J2 into "Lowland" West Asia (probably dominated by J1 initially). So J1 in Africa (excepted Lower Egypt) cannot be argued easily to be of "recent" Neolithic, much less Semitic or Arab origin: it must be older.
Also Ethio Helix commented in
this very interesting discussion at his blog that
Tofanelli 2009 found low diversity on NW African J1. However, to my knowledge, nobody has looked at NE/East African J1 diversity nor a proper study has been done on the substructure of this lineage in Africa. This leaves wide open the possibility that NW African J1 has a NE African origin, surely related to the expansion of Capsian culture or internal African Neolithic flows.
While this matter is not properly addressed, researchers will oversimplify and imagine J1 as simply West Asian influx. It is ultimately of course but I strongly suspect that it has a secondary and distinct NE African center at the Nile basin and this is being totally ignored.
Comparisons
This study offers several rough comparisons with nearby regions (but not West Africa), however they oversimplify some stuff (the already mentioned Y-DNA J1 or assigning all mtDNA L(xM,N) to East Africa, when it seems obvious that some lineages may be deeply rooted in NW Africa or others probably come from West Africa). For whatever it is worth anyhow, here there are two such questionable comparisons:
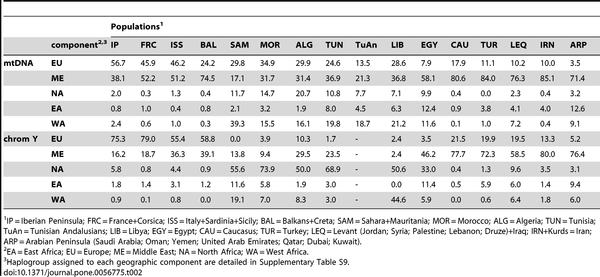 |
| Table 2. Geographic components (%) considered in Y-chromosome and mtDNA lineages. |
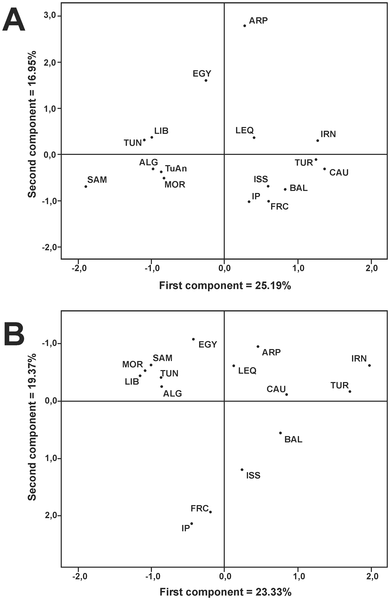 |
Figure 2. Graphical relationships among the studied populations.
PCA plots based on mtDNA (a) and Y-chromosome (b) polymorphism. Codes are as in Supplementary Tables S2 and S6. |
See also:


