April 27, 2013

Brotherton 2013: cherry-picking the evidence for mtDNA H

Unlike the conceptually akin paper by Fu 2013 (PPV - discussed here), this one is very neatly explained and allows no doubts on how they reached their conclusions. Another thing is to agree with the method being good enough to provide for any conclusions at all. It is still an interesting study on the evolution of mtDNA lineage H in the specific context of the Elba-Saale region of Germany.

Paul Brotherton et al., Neolithic mitochondrial haplogroup H genomes and the genetic origins of Europeans. Nature Communications 2013. Pay per viewLINK. [doi:10.1038/ncomms2656]

Abstract

Haplogroup H dominates present-day Western European mitochondrial DNA variability (>40%), yet was less common (~19%) among Early Neolithic farmers (~5450 BC) and virtually absent in Mesolithic hunter-gatherers. Here we investigate this major component of the maternal population history of modern Europeans and sequence 39 complete haplogroup H mitochondrial genomes from ancient human remains. We then compare this ‘real-time’ genetic data with cultural changes taking place between the Early Neolithic (~5450 BC) and Bronze Age (~2200 BC) in Central Europe. Our results reveal that the current diversity and distribution of haplogroup H were largely established by the Mid Neolithic (~4000 BC), but with substantial genetic contributions from subsequent pan-European cultures such as the Bell Beakers expanding out of Iberia in the Late Neolithic (~2800 BC). Dated haplogroup H genomes allow us to reconstruct the recent evolutionary history of haplogroup H and reveal a mutation rate 45% higher than current estimates for human mitochondria.

Let's deal with the interesting part first and then with their impossible molecular clock speculations. 

All the samples used in this study belong to haplogroup H as you can see in table 1. This does not allow to consider the overall apportion of H in each population, for which we would need to go to the original studies. For example in the region's LBK samples, H was just some 20% of the total, what alone talks of a population that was not at all like the modern one, never mind N1a. On the opposite side of the spectrum are the Bell Beaker (BBC) samples, where H made up 88% of the total (Adler 2012, discussed here), again non-modern but a possible source of H increase in frequency. 

We must keep in mind all the time that in this study only H is considered, with all the derived pros and cons. 

Maybe the most interesting result is therefore the comparison with modern populations done in fig. 2a:

Figure 2 | Population affinities of select Neolithic cultures. (a) PCA biplot based on the frequencies of 15 hg H sub-haplogroups (component loadings) from 37 present-dayWestern Eurasian and three ancient populations (light blue:Western Europe; dark blue: Central and Eastern Europe; orange; Near East,Caucasus and Anatolia; and pink: ancient samples). Populations are abbreviated as follows: GAL, Galicia; CNT, Cantabria; CAT, Catalonia; GAS, Galicia/Asturia; CAN, Cantabria2; POT, Potes; PAS, Pasiegos; VIZ, Vizcaya; GUI, Guipuzcoa; BMI, Basques; IPNE, Iberian Peninsula Northeast; TUR, Turkey; ARM, Armenia; GEO, Georgia; NWC, Northwest Caucasus; DAG, Dagestan; OSS, Ossetia; SYR, Syria; LBN, Lebanon; JOR, Jordan; ARB, Arabian Peninsula;ARE, Arabian Peninsula2; KBK, Karachay-Balkaria; MKD, Macedonia; VUR, Volga-Ural region; FIN, Finland; EST, Estonia; ESV, Eastern Slavs; SVK, Slovakia; FRA, France; BLK, Balkans; DEU, Germany; AUT, Austria, ROU, Romania; FRM, France Normandy; WIS, Western Isles; CZE, Czech Republic; LBK, Linear pottery culture; BBC, Bell Beaker culture; MNE, Middle Neolithic.

BBC (Bell Beaker) and LBK (Linear Pottery Culture) are clear-cut cultures in this graph. However MNE (Middle Neolithic) is a pooled agglomeration of several not too related cultures from the Late Neolithic and Early and Middle Chalcolithic. So, using the haplogroup vectors (grey), I remapped its unlikely components:

Fig. 2a annotated by Maju: green "MNE" cultures, grey: other cultures. Dotted circles just for reference.

Suddenly the mirage of modernity and homogeneity in MNE's H collapses, very specially for Salzmünde (2/2 H3) but really also for the other components of the MNE pool: Rössen (directly derived from LBK) appears here as Balcano-Estonian and similar to Bronze Age Sardinia, Schöningen (derived from Rössen) appears Norman French and close to the original LBK pool, the first Kurgan culture in Central Europe, Baalberge, is the only one really close to the MNE dot but its closest modern relatives are NE Iberians (IPNE), while its successor Salzmünde is "hyper-Iberian" much as Bell Beaker after them - however the intermediate Corded Ware, C.W., leans back to the right and appears Catalan.

No conclusions can be inferred from this, for that we'd need to compare whole genetic pools and not just H, which is minority in most ancient samples but for whatever is worth... I made yet another annotated version of this graph:

Fig. 2a annotated by Maju: changes in Central European mtDNA H composition along time (arrows).

I considered here Rössen as different from Schöningen, as Rössen or Epi-Rössen persisted in much of Germany and nearby Alpine areas for long, but feel free to draw or imagine it differently.

Whatever the case the appearance is of gradual "modernization" or "Germanization" of haplogroup H culminating in Baalberge, followed by an "Iberization" of the haplogroup pool in the Middle and Late Chalcolithic, coincident roughly with the expansion of Megalithism and Bell Beaker and just mildly countered by Indoeuropean expansion from the East (Corded Ware, Unetice). Here they mention six Unetice H sequences but, judging on Adler 2012, H was very very rare in this culture at least in the Elbe-Saale area (1/31).

Beyond this I doubt that the paper can provide us with any more enlightenment.


Molecular-clock-o-logy

It does provide for some false leads however.

The authors use this Elbe-Saale limited ancient mtDNA evidence to construct a "molecular clock":

Another major advantage of the temporal calibration points provided by ancient hg H mt genomes is that the data allow a relatively precise estimate of the evolutionary substitution rate for human mtDNA. The temporal dependency of evolutionary rates predicts that rate estimates measured over short timespans will be considerably higher than those using deep fossil calibrations, such as the human/chimpanzee split at ~6 million years.

6 million years?! Where have you been in the last five years, Paul? Ahem...

It doesn't really matter but it illustrates the reactionary scholastic inertia that plagues the Academia, very especially in the field of population genetics.

What matters is that they continue as follows:

(...) The rate calibrated by the Neolithic and Bronze Age sequences is 2.4 x10⁻⁸ substitutions per site per year (1.7–3.2x10⁻⁸; 95% high posterior density) for the entire mt genome, which is 1.45 (44.5%) higher than current estimates based on the traditional human/chimp split (for example, 1.66 x10 ⁻⁸ for the entire mt genome and 1.26x 10⁻⁸ for the coding region). Consequently, the calibrated ‘Neolithic’ rate infers a considerably younger coalescence date for hg H (10.9–19.1 kya) than those previously reported (19.2–21.4 kya for HVSI, 15.7–22.5 kya for the mt coding region or 14.7–22.6 kya when corrected for purifying selection).

What matters is that by cherry-picking only some sequences of ancient mtDNA H, they are denying themselves (and the rest of us by extension) a realistic calibration of the haplogroup. What happened with the Cantabrian Magdalenian and Epipaleolithic Basque H? What happened with Epipaleolithic Karelian H? Never mind Sunghir's Gravettian H17'27 or Taforalt's massive pool of R*-CRS, most likely H1 (Kéfi 2005), which may be more questionable but never rejected without direct negative evidence.

In other words: they are cherry-picking the evidence. They could argue that the Elbe-Saale data was the only one readily available for them to sequence in full or whatever and that therefore the evidence was cherry-picked by Destiny... but that would not justify in any case the arrogance of their conclusions: they should have been much more humble and admit that this evidence is only part of all the ancient mtDNA H (known or suspected), some of which is clearly much older and therefore much more relevant.

I illustrated this problem using their fig. 1a:

Fig. 1a, annotated by Maju.
(Note: one of the "Magdalenian" H* sequences from North Iberia is actually Epipaleolithic, my error)

In orange color I have marked an alternative minimal "molecular clock" extrapolation using the La Chora H6 sequence (Hervella 2006 open access). This is minimal because I'm assuming this sequence to be underived H6, if it'd be derived (what I don't know), the estimate would be even larger.

I have annotated all the sequences I am aware of ancient confirmed (unquestionable) mtDNA H. There are many more that are very likely, and in many cases older (see maps), but not yet confirmed.

So well, molecular-clock-o-logical pseudoscience again. It's a pity that otherwise respectable scientists pay tribute to this academic fetish.

The molecular clock hypothesis has never been proven, being a mere statistical construct, and it has many problems particularly in mitochondrial DNA, where branches are dramatically unequal, obeying to either: (a) randomness, (b) differential adaptive fitness or (c) ancient population dynamics (variable drift results depending on population size). I discussed some of that here and also here.

I beg here to population geneticists to be more serious and careful and not try to push their ideas against the available evidence. That is not proper of scientists but belongs to the field of ideological propaganda.


Update: La Chora Magdalenian H6 is probably H6a1, with implications for the age estimate of H.

All known H6 of Iberia and all or most of Western Europe is H6a1, while the "famous" Central Asian H6 (very minor overall) is all H6(xH6a), which is also relatively important in Eastern Europe. See Álvarez Iglesias 2009 (open access), especially Supp. Table 3. H6a(xH6a1) has only been detected so far in Austria (oversampled - I miss data from France again).

Brotherton's H6 only sample (Corded Ware) is H6a1a. Álvarez Iglesias did not test for this phylogenetic level, hence would show in his data as H6a1 but he did test for H6a1a1, only found precisely in Cantabria.

So the La Chora H6 Magdalenian sequence can be:
  • H6(xH6a): extremely rare in Western Europe modernly
  • H6a: reported in Austria only (modern sample)
  • H6a1: most common in Western Europe and especially North Iberia
  • H6a1a: like Brotherton's Corded Ware sequence
  • H6a1a1: found only in Cantabria modernly, it seems
  • etc. (PhyloTree allows for some other options)
I already discussed the possible age (using molecular clock theory, calibrated) of H if La Chora H6 would be H6-root. But, considering that H6b and H6c seem to be Eastern European or Central Asian, it seems more reasonable to think it is H6a or downstream of it. What would be the age range of H for the other possible assignations of La Chora's H6, would it be tested for coding region mutations? Let's see:

  • If H6a-root: 47,500 to 24,500 years ago (median: 36,000 BP)
  • If H6a1: 73,200 to 34,800 years ago (median: 54,000 BP)
Of course I do not really think that the molecular clock can be easily applied, if at all, to mtDNA, because the rarity of accumulating mutations poses way too many challenges. But if it had to be applied, as Brotherton, Fu, their teams and some amateurs seem to think, then we'd have to test the La Chora and La Pasiega (and Sunghir and others) for coding region mutations in order to have the most valid calibration points.

Otherwise is like the blind man who touched the trunk of an elephant and imagined it was like a snake.

April 24, 2013

Synthesis of the Spanish-language series on the expansion of H. sapiens (2)

One of the reasons I have been a bit too saturated and maybe not writing as much as usual is that I am collaborating in a series in Spanish language for the blog Noticias de Prehistoria - Prehistoria al Día.

I already mentioned last month the initial article[es] of the series by David Sánchez, which dealt with the African Middle Paleolithic (MSA, Lupembian, Aterian, etc.) We have not been idle in the meantime but actually wrote a number of other articles that may well be of your interest:

There is still a lot to do for the series to be complete but the time for a synthetic review in this blog is quite overdue. I will skip the brief intro to population genetics on the belief that most readers here have a decent idea, but the other three articles ask for due mention.


Expansion of H. sapiens in Africa (genetic viewpoint)


This is something that complements David's analysis of the African MP and that to a great extent I dealt with already at my former blog Leherensuge. I like graphs and maps because they often tell more than just words:

Basic mtDNA tree of Humankind
Branch length is proportional to coding region mutations from root per PhyloTree v.15 (L0k excepted)

We can see in this graph two main "moments" of diversification or expansion:
  1. The L0 and L2-6 nodes, followed soon by the L1 and L0a'b'f'k nodes
  2. The L0a'b'f, L0d and L2'3'4'6 nodes
The latter may well be calibrated with the archaeological evidence for the arrival of H. sapiens (MSA) to Southern Africa (L0d), which may be as old as 165 Ka but shows a clear increase in density since c. 130 Ka. I'd rather lean for the later date, that is roughly coincidental with the beginning of the Abbassia Pluvial, which must have provided good opportunities for expansion also in more northernly latitudes (the other nodes).

The first expansion is harder to estimate but c. 160 Ka. is a time in which we can see some of the first signs of expansion of our species within Africa (Jebel Irhoud and the already mentioned first Southern African MSA) so it is a tentative date. 

The geography of both expansions should be as follows (based on the raw data of Behar 2008):

Approx. geography of the first expansion of H. sapiens
(Purple dotted area indicates the max. likelihood for 'mtDNA Eve' location)
Approx. geography of the second expansion of H. sapiens

I also mentioned the expansion of L3, which preludes the migration Out of Africa, but this was already discussed in this entry.


Arrival to Arabia and Palestine


While most of the entries I am doing for this series deal with the genetic aspects, in this case I worked mostly with the archaeology, recycling many materials that are readily available in this blog and achieving the following synthetic map (recycling one by Armitage 2011) as central element of the article:


In addition to reviewing the archaeological discoveries of the last few years (and few older ones) I also discussed the issue of Neanderthal admixture, which most likely happened in this phase, and the possibility of some L(xM,N) lineages found in Arabia being from this period (see here).


Synthesis of Asian Prehistory


The last article so far in the series, authored by David Sánchez, has been published just today and is a very good visual review of the complex archaeological record of most of Asia in the period that interests us (most Middle Paleolithic with marginal mention of the earliest UP of West Asia, Siberia and neighboring areas, which will be reviewed more in depth in later articles). Probably the maps say it all, although we must understand that they only consider the best known sites:

Prior to Toba event (120-74 Ka BP)
(open circles: human remains, dots: other archaeological sites)
(notice that the date of Narmada hominin is most unclear, what is not reflected in the map)
Blue: 74-45 Ka BP
(stars: Neanderthal sites, open circles: other human remains, dots: archaeological sites, black: previous map)
Red: 45-35 Ka BP
(stars: neanderthal sites, open circles: other human remains, dots: archaeological sites, black & blue: previous maps)
Green: later expansion of H. sapiens in Northern Asia
(stars: Neanderthals, open circles: other human remains, dots: other archaeological sites, black, blue & red: previous maps)

I must say that the design of the maps is not quite the way I would have done myself but is still interesting. Very especially I miss lots of info on post-Toba South Asia. Also the Altai transition is not really well explained in my understanding. On the other hand East Asia is full of details and the overall picture of the archaeology of the Eurasian expansion is well described nonetheless.

PS- from the commentaries by David at his blog, it seems clear that he gives for granted the occupation of South Asia after Toba and therefore he did not consider it important to mark any more recent sites in the subcontinent. 

    April 22, 2013

    OSL dating: Brazilian site is 22,000 years ago

    Toca da Tira Peia is the new name of American prehistory, providing an OSL date for the layer of scattered stone tools of c. 22,000 years BP. Located near the also controversial Pedra Furada site, the date seems to give some support to those who dare to think outside the box on the early peopling of America.

    Christelle Lahaye et al., Human occupation in South America by 20,000 BC: the Toca da Tira Peia site, Piauí, Brazil. Science 2013. Pay per view LINK [doi:10.1016/j.jas.2013.02.019]

    Abstract

    When and how did the first human beings settle in the American continent? Numerous data, from archaeological researches as well as from palaeogenetics, anthropological and environmental studies, have led to partially contradictory interpretations in recent years, often because of the lack of a reliable chronological framework. The present study contributes to the establishment of such a framework using luminescence techniques to date a Brazilian archaeological site, the Toca da Tira Peia. It constitutes an exemplary case study: all our observations and measurements tend to prove the good integrity of the site and the anthropological nature of the artifacts and we are confident in the accuracy of the luminescence dating results. All these points underline the importance of the Toca da Tira Peia. The results bring new pieces of evidence of a human presence in the north-east of Brazil as early as 20,000 BC. The Toca da Tira Peia thus contributes to the rewriting of the history of the peopling of the American continent.

    There are slightly older sites in North America, however they are all surrounded into some degree of controversy: Topper in South Carolina is dated to c. 23,000 cal-BP (C14) while some sites in Alberta, located in the Mackenzie "ice-free corridor" have also dates under the LGM layer (i.e. > 21 Ka BP).

    There's actually nothing impossible about such early dates in my understanding.

    See also:

    Australian Burrup Peninsula's rock art is 30,000 years old

    The open air engravings have managed to survive thanks to the extremely low erosion rates produced by the hardness of the rock combined with the local climate. 


    The petroglyphs have been dated using the isotope beryllium-10. Based on current evidence, the archaeologists say, the occupation of the peninsula cannot be dated to before c. 42,000 years ago. 

    Source: Australian Geographic.

    Spring near Stonehenge occupied since Epipaleolithic

    (CC by Jeffrey Pfau)
    The spiritual relevance of Amesbury may well stem from a much older time than Neolithic or Chalcolithic. Recent research at a spring not far from Stonehenge has got radiocarbon dates of c. 7500 years ago, some three millennia before the building of the world-famous monument, and up to 4,700 BP, when the megalith was already in use.

    The low budget research project led by David Jacques of Open University, who had spotted the site, known as Vespasian's Camp, just a mile north of Stonehenge, in air photos a decade ago. The site had never been researched before.

    The findings imply some sort of continuity between the Epipaleolithic and Late Neolithic (i.e. Chalcolithic), although the details have yet to be systematized. 

    Source: BBC News (includes video).

    Ardipithecus ramidus' skull is hominin

    Ardi's skull reconstructed
    (CC by T. Michael Keesey)
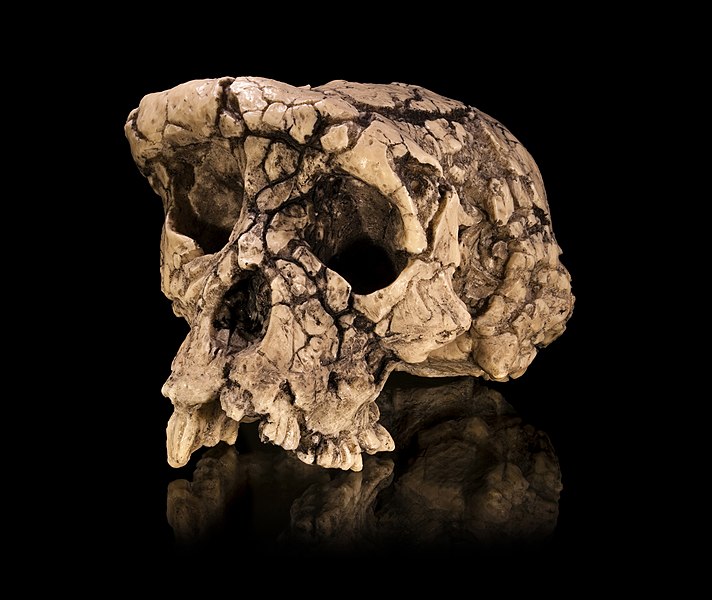
    I recently mentioned that Sahelanthropus tchadiensis 'Toumaï' was quite clearly within the hominini biological tribe, i.e. in the line leading to us and not anymore in the one leading to chimpanzees and bonobos. Now I have to echo the claim that a more recent being, Ardipithecus ramidus 'Ardi' also seems to have skull characteristics that place it in the hominin group. 

    While the relevance of Toumaï's grouping is much greater, because it help us to clarify the issue of Pan-Homo divergence dates, which seems to be of the order of c. 8-13 million years ago (Langergraber 2012), the case of Ardi is not without interest anyhow in the understanding of human evolution. 


    By examining 79 skull bases of chimps, gorillas, modern humans and ancient hominids, Kimbel’s group identified relationships among anatomical landmarks that distinguish apes from people and hominids. The researchers estimated the total length of A. ramidus’ skull bottom and found that it fell within a range characteristic of hominids, not apes.

    As in more recent members of the Australopithecus genus, such as the 3.2-million-year-old partial skeleton nicknamed Lucy, Ardipithecus ramidus displays a relatively short, humanlike skull base, Kimbel said.

    A new 3-D analysis of Ardi’s previously reconstructed pelvis, also presented April 11 at the anthropology meeting, finds a mix of monkey, ape and hominid characteristics. Although not confirming a consistently upright gait, this version of Ardi’s hips doesn’t undermine her proposed hominid status, said Nicole Webb of City University of New York, who led the research.

    As for Ardi’s disputed mode of travel, she probably had a two-legged gait “but didn’t use her hands much while upright,” said Caley Orr of Midwestern University in Downers Grove, Ill., who didn’t participate in the new research. 

    While Ardipithecus ramidus is dated to c. 4.4 Ma BP, there is another specimen of the same genus, Ardipithecus kadabba, dated to c. 5,7 Ma.


    Ref. AAPA 2013 meeting (abstracts):
    • W. Kimbel et al. Ardipithecus ramidus and the evolution of the human cranial base.
    • N. Webb et al. An analysis of the Ardipithecus ramidus pelvis reconstruction using 3D geometric morphometric techniques.

    April 18, 2013

    Fu 2013: new ancient mtDNA sequences and "molecular clock" madness

    It took me quite a while to get time to look at this study in some depth and when I finally did I must say I was rather disappointed. In any case the popular demand makes necessary to discuss it.

    Qiaomei Fu et al., A Revised Timescale for Human Evolution Based on Ancient Mitochondrial Genomes. Current Biology 2013. Pay per viewLINK [doi:10.1016/j.cub.2013.02.044]

    The study has two aspects: one, of great interest, which is the sequencing of a number of ancient remains, the other a complex and quite poorly explained and rendered speculation on how these sequences could be used to produce a refined molecular clock. 


    Ancient mtDNA sequences

    Most of the sequences used by Fu et al. in their molecular clock speculations are new and that part is very interesting:


    I have highlighted in lime green the new sequences, otherwise also noted by the marker b. It is of note that the "Crô-Magnon 1" sequence produced a C14 age of just a few centuries, being therefore removed from the collection. Other Crô-Magnon 1 remains produced no useful data. 

    The authors also decided to discard as possibly contaminated the UP sequence  from Pagicci Str. 4b. I have highlighted in red why they decided to do so: because the C→T misincorporation rate, characteristic of ancient remains, is too low, what makes contamination at least a serious probability. 

    So we have as new data for the Upper Paleolithic landscape in Europe that the people of Dolni Vestonice carried lineages U* (found also in Swabian Magdalenian) and U8, in the line of haplogroups K, U8a (Basque) and U8b (Eastern Mediterranean). Also some late UP and Epipaleolithic sequences from Oberkassel (Low Rhineland, Germany), Loschbour (Luxemburg) and Continenza (Abruzzo, Italy) are U5b variants, consistent with other findings from various parts of Europe. In Paglicci (Apulia, Italy), another sequence yielded U2'3'4'7'8'9, surely an extinct variant of the ancestor of U8 and U2 (among other lineages). No radiocarbon date is available for any of the Italian remains.

    In East Asia, Boschan, with B4c1a, provides one of the first Epipaleolithic sequences for the region. 


    Molecular clock madness

    The authors seem to intend, or so declare, to refine the molecular clock estimates by means of using these sequences as intermediate calibration references. Here I get the first big question: with all the literature on ancient DNA, why only these sequences? No idea.

    Then the contradictions arise. I believe that I have synthesized the most obvious ones in the following marginal annotations (in red) to their molecular clock estimates:


    Furthermore, the authors claim in the text that U5 is the oldest branch to diverge from U, however their TRMCA figure is of only 34.4 Ka BP (coding region), while Kostenki 14 has an age of 38 Ka BP and already carried U2, what really makes this claim extremely unlikely: U2 and its ancestor U2'3'4'7'8'9 should be considered the oldest U sublineage. 

    I do not understand either why they force age estimates for many lineages for which they have no working aDNA references and instead desist of estimating the age of lineages for which they have several calibration points, like U2'3'4'7'8'9 or B4'5 (aka B). 

    In brief: the claims of this paper on molecular-clock-o-logy are ill-explained, confusing, incoherent... a total mess. The raw data on ancient mtDNA is however good looking and of doubtless interest.

    April 15, 2013

    Central European Bell Beaker mtDNA: 88% H

    Bell beaker from Hungary (source)
    This doctoral thesis by Christina J. Adler is a most important study on the formation of the modern genetic pool (and hence population) in Central Europe. Previously we knew of data from the Paleolithic (U*), Epipaleolithic (U5, U4) and Earliest Neolithic (much more diverse but not yet modern in any sense). Then we had a huge blank until Urnfields (late Bronze), when the genetic pool seemed to be modern already. 

    This thesis (found via Eurogenes) fills in the blanks at least to some extent.

    Christina Jane Adler, Ancient DNA studies of Human Evolution. University of Adelaide (thesis), 2012. Freely accessibleLINK 

    The thesis is, as usual in this kind of studies, extremely long; even the abstract is too long to copy here. Just to mention that the hard data (graphs, tables) is from page 96 on, although there are some other aspects in the text that deserve mention.

    Critically Adler could research the ancient mtDNA of Bell Beaker and Únětice culture populations from several German sites, adding important information about the genetic pools of the Late Chalcolithic and Early Bronze Age. She also goes over previous studies on the same area.

    The new data (table 2) can be synthesized as follows:
    • Bell Beaker:
      • Quedlinburg XII: 3 H-CRS (H1?), 1 J
      • Rothenschirmbach: 2 H3, 1 H5
      • Alberstedt: 1 H-CRS (H1?)
      • Total (simplified): 7 H, 1 J
    • Únětice:
      • Quedlinburg VIII: 1 U5a1a, 1 U2, 1 U*, 1 H7a, 1 T1
      • Quedlinburg XII: 1 U5a1a
      • Quedlinburg XIV: 1 T2
      • Esperstedt: 2 I*, 1 I1, 1 U5a1, 1 U5b, 1 T2b, 1 T2*, 1 W, 1 X
      • Total (simplified): 4 U5, 3 I, 3 T2, 1 T1, 1 U2, 1 U*, 1 W, 1 X
    This extremely high apportion of mtDNA H is almost unprecedented in ancient (and probably also modern) mtDNA samples, in Europe only the Portuguese Neolithic and Epipaleolithic samples by Chandler 2005 seem to be comparable in any way, suggesting that this most important European matrilineage may have expanded from Iberia in the Chalcolithic (aka Late Neolithic in some Anglosaxon literature) with either Megalithism, Bell Beaker or both. 

    It also seems to contradict the quite mainstream theory of Central European origins (post Corded Ware) of the Bell Beaker phenomenon and instead support the less popular Iberian origin theory. Until this very day I have been adherent to the Bohemian "Corded" origin theory (with some doubts) but today I have to admit that this genetic data weights heavily for the Iberian origin model, which in turn would fit very nicely with Venneman's Vasconic substrate theory. 

    Regardless of what I may think, Adler herself is clearly pushing for the Iberian origin model all along in her thesis, theory which she seems to find the best fit scenario. 

    Of course, the genetic landscape was not simply stabilized with Megalithism and Bell Beaker, more waves followed. The Western Indoeuropean Únětice culture seems to fit here as archetypal or potential source of other layers, resulting in modern genetic pools in many places (although as I have mentioned several times the Basque one seems stable since Early Neolithic). These Indoeuropean migrations (Tumuli, Urnfields, Hallstatt, La Tène, etc.) should explain the dilution of the extremely high apportion of H found in these Bell Beaker burials, as well as in Portugal (nowadays H is 40-50% in most of Western and Northern Europe).

    The Únětice genetic landscape seems particularly interesting for including which is surely the oldest mtDNA I in Northern Europe (later very common in Viking Era Denmark). The only older case I know is again Early Neolithic Basque (same Paternabidea sample mentioned above) but I don't see any plausible relation. 


    PS- I know still have in the "to do" department the paper of Qiaomei Fu, "A Revised Timescale for Human Evolution Based on Ancient Mitochondrial Genomes", which several readers were so kind to send me a copy of weeks ago, encouraging me to write on it. My apologies but I'm on it and I promise to write a review this very week unless the sky falls on my head (or real life equivalent).

    April 14, 2013

    Southern Native American Y-DNA: no correlation with language, extensive info on haplogroup C3

    Genetics does not necessarily correlate with linguistic families. It often does not. This seems to be the case with Native Americans as well.

    Lutz Roewer et al., Continent-Wide Decoupling of Y-Chromosomal Genetic Variation from Language and Geography in Native South Americans. PLoS Genetics 2013. Open accessLINK [doi:10.1371/journal.pgen.1003460]

    Abstract

    Numerous studies of human populations in Europe and Asia have revealed a concordance between their extant genetic structure and the prevailing regional pattern of geography and language. For native South Americans, however, such evidence has been lacking so far. Therefore, we examined the relationship between Y-chromosomal genotype on the one hand, and male geographic origin and linguistic affiliation on the other, in the largest study of South American natives to date in terms of sampled individuals and populations. A total of 1,011 individuals, representing 50 tribal populations from 81 settlements, were genotyped for up to 17 short tandem repeat (STR) markers and 16 single nucleotide polymorphisms (Y-SNPs), the latter resolving phylogenetic lineages Q and C. Virtually no structure became apparent for the extant Y-chromosomal genetic variation of South American males that could sensibly be related to their inter-tribal geographic and linguistic relationships. This continent-wide decoupling is consistent with a rapid peopling of the continent followed by long periods of isolation in small groups. Furthermore, for the first time, we identified a distinct geographical cluster of Y-SNP lineages C-M217 (C3*) in South America. Such haplotypes are virtually absent from North and Central America, but occur at high frequency in Asia. Together with the locally confined Y-STR autocorrelation observed in our study as a whole, the available data therefore suggest a late introduction of C3* into South America no more than 6,000 years ago, perhaps via coastal or trans-Pacific routes. Extensive simulations revealed that the observed lack of haplogroup C3* among extant North and Central American natives is only compatible with low levels of migration between the ancestor populations of C3* carriers and non-carriers. In summary, our data highlight the fact that a pronounced correlation between genetic and geographic/cultural structure can only be expected under very specific conditions, most of which are likely not to have been met by the ancestors of native South Americans.


    There's only so much to say about language families and patrilineages: that they do not agree in any obvious way:

    Table 1. Correlation between Y-SNP haplogroup and language class.


    However the paper also address the interesting matter of NE Asian and Native American paragroup C3(xC3b), which is almost only found among Ecuadorean Natives (Kichwa and Waorani speakers). The only other known case among Native Americans, according to the authors, is an individual of Southern Alaskan native ancestry. 


    Figure 1. Origin of male native South American samples.
    For each sampling site, its geographic location as well as the size (proportional to the circle area) and Y-SNP haplogroup composition of the respective sample are shown. Blue lines: major aquatic systems; dashed gray lines: current national boundaries.


    Overall distribution of Y-DNA C3* (yellow), which I understand to mean C3(xC3b) for this study:


    Figure 4. Prevalence of Y-SNP haplogroup C-M217 (C3*) around the Pacific Ocean.
    Light blue: previous studies; dark blue: present study; yellow: relative frequency of C-M217 (C3*) carriers.

    The most interesting information anyhow may be in the haplotype network:


    Figure 5. Median-joining network of 167 different Asian and American Y-STR haplotypes carrying Y-SNP haplogroup C3* (from this and previously published studies).
    The median-joining network is based upon markers DYS19, DYS389I, DYS389II-DYS389I, DYS390, DYS391, DYS392, DYS393 and DYS439 (see Materials and Methods for details). ALA: Alaskan; KOR: Korean; CHI: Chinese, including Daur, Uygur, Manchu; MON: Mongolian, including Kalmyk, Tuva, Buryat; ANA: Anatolian; INDO: Vietnamese, Thai, Malaysian, Indonesian, Philippines; JAP: Japanese; TIB: Tibetan, Nepalese; ALT: Altaian, including Kazakh, Uzbek; SIB: Teleut, Khamnigan, Evenk, Koryak; ECU: Ecuadorian, including Waorani, Lowland Kichwa, COL: Colombia, including Wayuu; RUS: Russian.

    The network clearly shows that the Native American C3* haplotypes are mostly or totally related to a cluster of Altaian, Mongol and Chinese roots. The Altaian connection is particularly strong for all but one of the lineages. This is very much concordant with a proto-Amerind patrilineal origin in Altai (where NE Asian and American Y-DNA Q and mtDNA X2 variants surely originated in the early Upper Paleolithic) which traveled to Beringia via Mongolia or nearby regions, spreading the mode 4 (blade tech) to East Asia c. 30,000 years ago.

    This is not the view of the authors but mine. The authors instead speculate with (i) a late wave or (ii) even naval contact between East Asia and South America. I find both hypothesis lacking merit and I lean for a founder effect model instead.

    On the other hand, the C3b presence in NW North America, critically among Na-Dene speakers, may still represent a second wave: that of Na-Dene speakers, whose "recent" linguistic connections to Siberia (Yenisean family) have found strong support in the last years. 

    'Neanderthal' allele that is probably not Neanderthal in modern humans

    This is a generally well finished study on an allele shared by (some) modern humans, Neanderthals and "Denisovans" but which the authors properly gouge to be probably not Neanderthal in origin among us.

    Omer Gockumen et al., Balancing Selection on a Regulatory Region Exhibiting Ancient Variation That Predates Human–Neandertal Divergence. PLoS Genetics 2013. Open accessLINK [doi:10.1371/journal.pgen.1003404]

    Abstract

    Ancient population structure shaping contemporary genetic variation has been recently appreciated and has important implications regarding our understanding of the structure of modern human genomes. We identified a ~36-kb DNA segment in the human genome that displays an ancient substructure. The variation at this locus exists primarily as two highly divergent haplogroups. One of these haplogroups (the NE1 haplogroup) aligns with the Neandertal haplotype and contains a 4.6-kb deletion polymorphism in perfect linkage disequilibrium with 12 single nucleotide polymorphisms (SNPs) across diverse populations. The other haplogroup, which does not contain the 4.6-kb deletion, aligns with the chimpanzee haplotype and is likely ancestral. Africans have higher overall pairwise differences with the Neandertal haplotype than Eurasians do for this NE1 locus (p<10−15). Moreover, the nucleotide diversity at this locus is higher in Eurasians than in Africans. These results mimic signatures of recent Neandertal admixture contributing to this locus. However, an in-depth assessment of the variation in this region across multiple populations reveals that African NE1 haplotypes, albeit rare, harbor more sequence variation than NE1 haplotypes found in Europeans, indicating an ancient African origin of this haplogroup and refuting recent Neandertal admixture. Population genetic analyses of the SNPs within each of these haplogroups, along with genome-wide comparisons revealed significant FST (p = 0.00003) and positive Tajima's D (p = 0.00285) statistics, pointing to non-neutral evolution of this locus. The NE1 locus harbors no protein-coding genes, but contains transcribed sequences as well as sequences with putative regulatory function based on bioinformatic predictions and in vitro experiments. We postulate that the variation observed at this locus predates Human–Neandertal divergence and is evolving under balancing selection, especially among European populations.


    The paper discusses an allele (NE1) of APOBEC3G, a gene arguably related to anti-viral immunity, which is found primarily in its derived variant among non-Africans (especially South Asians, Europeans and Native Americans). In similar cases other similar studies have claimed that it should be a Neanderthal introgression, ignoring the presence of the relevant allele at low frequencies in Africa. The authors of this study do not commit this error but finding it at low frequencies not just among the Maasai and the Luhya but also among Pygmies, they consider that there is a high likelihood of the allele found among Eurasians and Native Americans to have originated among Homo sapiens in Africa and then maybe favored by natural selection or other mechanisms outside the ancestral continent. 


    Figure 3. Ancient African origins of the NE1 haplogroup.
    (A) Models of scenarios that could lead to NE1 haplotypes observed in humans and Neandertals. The frequency of the NE1 haplogroup is depicted in red and the frequency of the nonNE1 haplogroup in yellow. The red corresponds to higher frequencies, whereas yellow corresponds to lower frequencies of the NE1 haplotypes in the population. The arrows represent the direction of possible admixture events. The left panel represents a model, under which the NE1 haplotypes admixed into Eurasian populations (Asn and Eur) after Human-Neandertal divergence. The second model, which is depicted in the central panel, is similar to the first model, except with the addition of more recent back migration of Eurasian NE1 haplotypes into Africa (Afr). The right panel shows the third model, under which the NE1 haplotypes among humans are explained by persistence of ancient African substructure. All these scenarios were based on the assumption that the NE1 haplotype occurs at high frequency or is fixed in the Neandertal population given that the available Neandertal sequences align well to the NE1 haplotype. (B) Geographical distribution of the NE1 haplogroup. We estimated the proportion of chromosomes that carry the CNVR8163.1 deletion from various sources described in Materials and Methods. The dark red portion of each circle represents the frequency of the homozygous nonNE1 genotypes, the white represents the homozygous NE1 genotypes and the light red represents the frequency of heterozygote genotypes. Note the existence of the NE1 haplotypes (i.e., as heterozygotes, light red) among sub-Saharan African populations (e.g., LWK and ASW) as well as the high frequency of heterozygotes (light red) in the European populations. (C) The pairwise distances between the African (Afr) NE1 haplotypes, the Asian (Asn) NE1 haplotypes, and the European (Eur) NE1 haplotypes, calculated using phase 1 data from the 1000 Genomes Project. p-values were calculated by the Mann-Whitney test.
    Figure 4. Selection acting on the NE1 locus.
    (A) Maximum likelihood tree based on select NE1 (red) and nonNE1 (blue) haplotypes, with the chimpanzee haplotype as an outgroup. The gray-box indicates the estimated interval for the Human-Neandertal divergence between 400,000–800,000 years ago [51]. Note that the coalescence at this locus is extremely long and very unlikely to have evolved under neutral conditions as modeled here. (B) Comparison of FST and Tajima's D values of 10 kb intervals across the human genome. The red to dark blue gradient indicates decreased density of observed events at a given location in the graph. The NE1 locus, and other loci with similar profiles, are highlighted in white.

    While the Neanderthal-Sapiens divergence estimate they use (fig. 4A) is clearly more recent than I would gladly accept (I'm more into 1.3-0.9 Ma BP, based on archaeological and paleoanthropological data), it does not seem to matter for the conclusions, as they estimate that the two main haplotypes in chromosome 22 related to this allele diverged much earlier, at the beginnings of the history of the genus Homo. 

    Chimpanzees by the way have the non-NE1 allele, which is therefore considered ancestral.

    April 13, 2013

    Huge palisade enclosure in Wales

    The small village of Walton (Powys, Wales) was, it seems, long ago a ceremonial center for the ancient peoples of Britain between 3800 and 2300 BCE. At the very least it had a huge palisaded enclosure that could have accommodated five buildings of the size of the London Olympic Stadium within its circa 1200 posts, each said to be 4 m. high. 

    Digital reconstruction of the ceremonial site


    Besides the structure itself, which has been investigated for decades, pottery, flint tools and food remains have been found. Apparently the site hosted some kind of regular festival of unknown characteristics. 

    Source: Wales Online.

    Fish soup in Japanese pots from 15,000 years ago

    The revealing pot
    Not the oldest known pottery on Earth, which is from Southern China and dated c. 20,000 BP, but close enough: Paleolithic peoples of Japan (proto-Ainu?) used ceramic pots to cook fish some 15,000 years ago.

    O.E. Craig et al., Earliest evidence for the use of pottery. Nature 2013. Pay per viewLINK [doi:10.1038/nature12109]

    Abstract

    Pottery was a hunter-gatherer innovation that first emerged in East Asia between 20,000 and 12,000 calibrated years before present1, 2 (cal bp), towards the end of the Late Pleistocene epoch, a period of time when humans were adjusting to changing climates and new environments. Ceramic container technologies were one of a range of late glacial adaptations that were pivotal to structuring subsequent cultural trajectories in different regions of the world, but the reasons for their emergence and widespread uptake are poorly understood. The first ceramic containers must have provided prehistoric hunter-gatherers with attractive new strategies for processing and consuming foodstuffs, but virtually nothing is known of how early pots were used. Here we report the chemical analysis of food residues associated with Late Pleistocene pottery, focusing on one of the best-studied prehistoric ceramic sequences in the world, the Japanese Jōmon. We demonstrate that lipids can be recovered reliably from charred surface deposits adhering to pottery dating from about 15,000 to 11,800 cal bp (the Incipient Jōmon period), the oldest pottery so far investigated, and that in most cases these organic compounds are unequivocally derived from processing freshwater and marine organisms. Stable isotope data support the lipid evidence and suggest that most of the 101 charred deposits analysed, from across the major islands of Japan, were derived from high-trophic-level aquatic food. Productive aquatic ecotones were heavily exploited by late glacial foragers3, perhaps providing an initial impetus for investment in ceramic container technology, and paving the way for further intensification of pottery use by hunter-gatherers in the early Holocene epoch. Now that we have shown that it is possible to analyse organic residues from some of the world’s earliest ceramic vessels, the subsequent development of this critical technology can be clarified through further widespread testing of hunter-gatherer pottery from later periods.

    Main source: Pileta[es/en].

    Rock art from Baja California dates to c. 9,000 years ago, maybe even older

    Catalan researchers from the IPHES have been studying the impressive rock art of the caves of Baja California Sur (Mexico) and concluded that some of the art is from c. 8-9,000 years ago. However contextual dates are sometimes older, of c. 10-11,000 years ago. 

    Source: El Universal[es], which has many more photos.


    For decades it was believed, following the pioneer work of Clement Meighan, that the art was from the 13th century CE. However in the 1980s the more in-depth research by Catalan scientists revealed that it is in fact from much older dates, at least 5,000 years ago. These days it has been revealed that they are even older in some cases. 

    The rock art is distributed by many areas of Baja California Sur, very especially the Sierra de San Francisco, which alone hosts more than 250 sites. These sites were often occupied through millennia, until the 18th century CE in some cases. Even later they have been used as shelters for sheep, however nowadays they do enjoy state and UNESCO protection. 

    The most outstanding cave, La Pintada (the painted one), appears to have indications of astronomical knowledge. In the words of Viñas Vallverdú:

    In the particular case of La Pintada there are many markings of astronomical type, spots where it is indicated that the Sun illuminates in certain time of the year, signaling a date in their calendar. That way they knew that, when the Sun hit one of those marks, it was time to collect the pitahaya or that the rain period was nearing.

    The research is part of an international project by IPHES and the Instituto Nacional de Antropología e Historia (INAH) of Mexico, which is surveying the prehistory of the North American federation. 

    The study will be published as the doctoral thesis of lead researcher Ramón Viñas Vallverdú (IPHES).

    Source: El Universal[es] (includes a very beautiful photo-gallery).

    Sahara 5000 years ago: from grassland to desert in no time

    Saharan dust storm blowing into the Ocean (NASA)
    Live science reports about a new study, to be published in the Earth and Planetary Science Letters journal, that concludes, based on the dust sediments in the Atlantic Ocean, that the change from grassland to desert of the Sahara some 5000 years ago was very quick. 

    In the wet period, known as Neolithic Semi-Pluvial, the dust accumulated in oceanic sediments was only 20% of present day. But that changed very fast around 5000 BP. 

    Not many details are provided however.

    Bisphenol A severely disrupts fetal epigenetics

    Water bottle containing bisphenol A
    The most controversial chemical compound bisphenol A is found in many plastics, including sometimes those used as food or water containers. This study adds to the long list of known harms of this chemical, which nevertheless remains widely allowed.

    Martha Susiarjo et al., Bisphenol A Exposure Disrupts Genomic Imprinting in the Mouse. PLoS Genetics 2013. Open accessLINK [doi:10.1371/journal.pgen.1003401]

    Abstract

    Exposure to endocrine disruptors is associated with developmental defects. One compound of concern, to which humans are widely exposed, is bisphenol A (BPA). In model organisms, BPA exposure is linked to metabolic disorders, infertility, cancer, and behavior anomalies. Recently, BPA exposure has been linked to DNA methylation changes, indicating that epigenetic mechanisms may be relevant. We investigated effects of exposure on genomic imprinting in the mouse as imprinted genes are regulated by differential DNA methylation and aberrant imprinting disrupts fetal, placental, and postnatal development. Through allele-specific and quantitative real-time PCR analysis, we demonstrated that maternal BPA exposure during late stages of oocyte development and early stages of embryonic development significantly disrupted imprinted gene expression in embryonic day (E) 9.5 and 12.5 embryos and placentas. The affected genes included Snrpn, Ube3a, Igf2, Kcnq1ot1, Cdkn1c, and Ascl2; mutations and aberrant regulation of these genes are associated with imprinting disorders in humans. Furthermore, the majority of affected genes were expressed abnormally in the placenta. DNA methylation studies showed that BPA exposure significantly altered the methylation levels of differentially methylated regions (DMRs) including the Snrpn imprinting control region (ICR) and Igf2 DMR1. Moreover, exposure significantly reduced genome-wide methylation levels in the placenta, but not the embryo. Histological and immunohistochemical examinations revealed that these epigenetic defects were associated with abnormal placental development. In contrast to this early exposure paradigm, exposure outside of the epigenetic reprogramming window did not cause significant imprinting perturbations. Our data suggest that early exposure to common environmental compounds has the potential to disrupt fetal and postnatal health through epigenetic changes in the embryo and abnormal development of the placenta.

    April 7, 2013

    Brain shape favors 'Toumaï' as a human ancestor

    The seven million years old Sahelanthropus tchadensis (i.e. Sahel man from Chad), nicknamed Toumaï, already had a hominin structure in its small brain:

    ... though Toumaï’s brain was apelike in its small size, it was apparently homininlike in other ways. In a presentation given on April 2 at the annual meeting of the Paleoanthropology Society, Bienvenu reported that the endocast shows strongly posteriorly projecting occipital lobes, a tilted brainstem, and a laterally expanded prefrontal cortex, among other hominin brain characteristics.

    Other human-like traits in Toumaï are small canines and the forward position of its foramen magnum (where the backbone connects to the skull), which suggest upright walking, which is now argued to be related to brain reorganization. 

    This clearly confirms, as I have insisted so much, that the Pan-Homo divergence date is necessarily older than 7 million years, because Toumaï  was already closer to us than chimpanzees and bonobos, our closest living relatives.