Showing posts with label Eurasian colonization. Show all posts

March 16, 2018

Ancient genomes of SE Asia

Just a quick mention because I have such a long queue of stuff from Europe that I really have no time to look but very shallowly onto this study, which looks extremely interesting. Credit for the reference to Kristiina.

Hugh McColl, Fernando Racimo, Lasse Vinner, Fabrice Demeter et al., Ancient Genomics Reveals Four Prehistoric Migration Waves into Southeast Asia, BioRXiv (pre-pub) 2018. doi:10.1101/278374

Abstract

Two distinct population models have been put forward to explain present-day human diversity in Southeast Asia. The first model proposes long-term continuity (Regional Continuity model) while the other suggests two waves of dispersal (Two Layer model). Here, we use whole-genome capture in combination with shotgun sequencing to generate 25 ancient human genome sequences from mainland and island Southeast Asia, and directly test the two competing hypotheses. We find that early genomes from Hoabinhian hunter-gatherer contexts in Laos and Malaysia have genetic affinities with the Onge hunter-gatherers from the Andaman Islands, while Southeast Asian Neolithic farmers have a distinct East Asian genomic ancestry related to present-day Austroasiatic-speaking populations. We also identify two further migratory events, consistent with the expansion of speakers of Austronesian languages into Island Southeast Asia ca. 4 kya, and the expansion by East Asians into northern Vietnam ca. 2 kya. These findings support the Two Layer model for the early peopling of Southeast Asia and highlight the complexities of dispersal patterns from East Asia.


November 2, 2016

Main Neanderthal admixture episode was c. 100,000 years ago.


This is really nice to read, considering that the archaeological data strongly favors a single out-of-Africa migration around that date (c. 125 Ka to Arabia and Palestine, see this, this and this among others, c. 100 Ka to South and East Asia) and that my own genetic modeling on mitochondrial DNA also fits that chronology (unlike most "molecular clock" scholastic rantings that are sold as "scientific truth" with no substantive backing whatsoever).

Admittedly the paper is not new (was published in February) but you know I have been missing important stuff with my information-overload stress crisis, so I'm making up now. Thanks to Ryan for bringing this up.

Martin Kuhlwilm et al., Ancient gene flow from early modern humans into Eastern Neanderthals. Nature 2016. Pay per viewLINK [doi:10.1038/nature16544]

Abstract

It has been shown that Neanderthals contributed genetically to modern humans outside Africa 47,000–65,000 years ago. Here we analyse the genomes of a Neanderthal and a Denisovan from the Altai Mountains in Siberia together with the sequences of chromosome 21 of two Neanderthals from Spain and Croatia. We find that a population that diverged early from other modern humans in Africa contributed genetically to the ancestors of Neanderthals from the Altai Mountains roughly 100,000 years ago. By contrast, we do not detect such a genetic contribution in the Denisovan or the two European Neanderthals. We conclude that in addition to later interbreeding events, the ancestors of Neanderthals from the Altai Mountains and early modern humans met and interbred, possibly in the Near East, many thousands of years earlier than previously thought.

As the title and the abstract say, Homo sapiens migrants out of Africa (i.e. into Asia and only later into its periphery) genetically influenced the branch of Neanderthals represented by the Altai specimen, what we can consider "Asian Neanderthals" but not the branch represented by El Sidrón and Vindija ("European Neanderthals"). This happened some 100 Ka ago, coincident with the archaeologically demonstrated dates for the out-of-Africa migration for our species and also likely Neanderthal-Sapiens hybrid fossils like Skhul-5 (right -- notice its lack of chin, a key and universal trait of H. sapiens, which allows us to give up with heavy browridges and other facial armature and still retain a strong bite, among other Neanderthaloid features, however it has a rounded and elevated skullcap with a high, almost vertical, forehead, a clear Sapiens trait). 

The flow was in both directions. I do not have access to the paper itself but it is clear in the supplemental material (EDF-1). This hybridization event was distributed quite evenly among all "Greater Asians" or "non-Africans" in our species. The slightly lower score in French is surely caused by Neolithic admixture later on, bringing African-like genetics to Europe, which are absent in most of Asia, as well as in aboriginal Australasia and America. 

Another apparent highlight in this paper (EDF-7) is that a second Neanderthal population, belonging to what I called above "European Neanderthals" (but related only to El Sidrón and not to Vindija) seems to have starred a second hybridization event affecting mostly Eastern populations (Han Chinese and Papuans in this paper's dataset). This, if confirmed, is quite unexpected and would require some explanation of the kind: there was a "European Neanderthal" population somewhere in Asia in the early times of Homo sapiens colonization and they got again admixed but this time affecting the derived populations in an irregular way. These irregularities would eventually be "flattened", I guess, at regional levels but for then the West Eurasian founders were out of the way. 

A somewhat related recent paper, also mentioned by Ryan, is S. Sankararaman et al., The Combined Landscape of Denisovan and Neanderthal Ancestry in Present-Day Humans (Current Biology 2016), also pay-per-view, so judging on supplemental materials only. I must say I don't like this one that much but at least table S2 offers a summary of the state of the art of estimates of Neanderthal and "Denisovan" (H. heidelbergensis) admixture in a lot of populations (and not just three). It is apparent there that there is more Neanderthal admixture towards the East of Asia or "Greater Asia", what is very much counterintuitive and demands that a Neanderthal population (a "European Neanderthal" one per Kuhlwilm's data) existed somewhere towards the East of Asia, enabling for this secondary Neanderthal admixture event. 

Perplexing maybe but that's what the data says. I wish we could find and sequence some of those Eastern Neanderthals which are so far just a genetic ghost, with the only possible known paleontological evidence being the Narmada skullcap, which is admittedly very much Neanderthal-like but is not associated in any way to Neanderthals' typical industry: the Mousterian, which has never been found east of Iran nor south of Mongolia. 

Some have argued that the Zhirendong jaw, one of the key evidences for c. 100 Ka H. sapiens settlement of much of Asia, is a hybrid one, with clear H. sapiens traits (among others it has a chin) but also maybe "archaic" traits (among others its chin is rather small). If so, then we may be at the same time in this case before evidence of both the early migration of our species, Homo sapiens, to East Asia (or SE Asia, as it's quite to the south of China) and the second admixture event with Neanderthals, with those ghostly Oriental Neanderthals, related to El Sidrón ones in the Far West, quite paradoxically, that we have yet to properly identify.

February 14, 2016

Ancient DNA confirms that dogs were first domesticated in Southeast Asia

Quickies

I have already argued for this scenario several times (as opposed to the Neolithic West Asian one, which just makes no sense and rather seems to represent a secondary layer of dog genetics), so I'm very glad that ancient DNA research can confirm it even further.

Guo-Dong Wang, Out of southern East Asia: the natural history of domestic dogs across the world. Cell Research 2015. Open accessLINK [doi:10.1038/cr.2015.147]

Abstract

The origin and evolution of the domestic dog remains a controversial question for the scientific community, with basic aspects such as the place and date of origin, and the number of times dogs were domesticated, open to dispute. Using whole genome sequences from a total of 58 canids (12 gray wolves, 27 primitive dogs from Asia and Africa, and a collection of 19 diverse breeds from across the world), we find that dogs from southern East Asia have significantly higher genetic diversity compared to other populations, and are the most basal group relating to gray wolves, indicating an ancient origin of domestic dogs in southern East Asia 33 000 years ago. Around 15 000 years ago, a subset of ancestral dogs started migrating to the Middle East, Africa and Europe, arriving in Europe at about 10 000 years ago. One of the out of Asia lineages also migrated back to the east, creating a series of admixed populations with the endemic Asian lineages in northern China before migrating to the New World. For the first time, our study unravels an extraordinary journey that the domestic dog has traveled on earth.

I will dare, once again, to challenge the age guesstimates and suggest that they are in fact notably older, maybe even double the proposed age. Notice that I tentatively associate the domestication of dogs with the massive secondary "out of SE Asia" expansion led by Y-DNA haplogroup K2 and mtDNA haplogroup R, which probably took place, at least in my understanding, at some point between the Toba catastrophe (c. 74 Ka BP) and the beginnings of the Upper Paleolithic in Western Eurasia (c. 50 Ka BP), so, yeah, c. 65 or 60 Ka BP is a good age estimate for me, more so considering that we already know of domesticated dogs far from SE Asia, in 33,000 BP.


See also:

January 16, 2016

>100 Ka old tools found in Sulawesi

Quickies

Flake type tools dated to approx. 118,000 years ago have been found in Sulawesi (Indonesia). They imply that some species of human was making them but it is unclear which one. Homo floresiensis (alias The Hobbit) is maybe the first one that comes to mind but actually there are other possibilities: on one hand the significant H. heidelbergensis (alias Denisovan) admixture found in Australasian aboriginals would be consistent with its presence somewhere in SE Asia, Wallacea even, but another serious possibility is that they are in fact made by H. sapiens, whose presence in other parts of Asia soon after this date (or even before in the case of West Asia) is well known by now.

January 9, 2016

Good documentaries on human Prehistory

I just watched the documentary "First Peoples - Asia" (by NOVA) and found it quite good, discussing many of the issues that I and the readers of this blog have been following and discussing the last years on the settling of Asia (and geographical dependencies): the Zhirendong jaw, the Nubian points of Arabia, the archaic admixture events... 

The only issue is that for some odd reason (copyright masking?) interviewed people voices often have a too high pitch.

I hope the other four documentaries of the series are similarly good. I haven't watched them yet but the full playlist is embedded below beginning with the Asian colonization movie. For many readers it won't be that interesting personally (they already know all or most of it, maybe even better than what the movie explains) but it is still a promising tool to share your hobby with family and friends, so watch it in good company. 

Enjoy!


Update (Jan 9):

I've watched already four of them (Africa, Asia, Australia and Europe) and the European one is no doubt the worst: a superficial Neanderthal hybridization neo-myth spearheaded by John Hawks. Also the only map or description of the route followed by modern humans to Europe is absolute nonsense: directly from Africa via Palestine, when in fact it's extremely clear that at least most of the lineages went all the way to SE Asia and back before ever entering Europe. What happened to the spear in the rib of Zawi Chemi Shanidar man? What happened to the very fast replacement in the early Aurignacian, coincident with the Campanian Ignimbrite eruption? What about dogs? Not a word! Just whitewashing of the probably quite violent Sapiens-Neanderthal interaction. You can skip that one, really, it's pretty much nonsense.

Some hyper-hybridationism permeates all the documentaries but the others seem much better: the Asia one is quite good, the Africa one is not bad either (although could be much better if they paid more attention to archaeology, also Africa deserves 50% of the documentary space probably), the Australia one is OK but it simply ignores Papua and Wallacea altogether, what is a bit perplexing to say the least. The Europe one is just horrible: it has some facts but half of it its John Hawks' preaching his particular ideology about people being oh-so-nice that they probably used spears as toothpicks, Paabo making a lot of extra work for the cleaning crew (spectacular admittedly but should be in a separate Neanderthal docu, not in one dedicated to H. sapiens) and some real archaeology scattered around (but definitely not enough at all).

November 2, 2015

Selection against Neanderthal introgression?

Quickies

A couple of papers have been pre-published these days discussing the apparent selection against most (but not all) of the Neanderthal inheritance among modern ex-Africa humans.

Ivan Juric, Simon Aeschbacher & Graham Coop, The Strength of Selection Against Neanderthal Introgression. BioRxiv 2015 (pre-pub). Freely accessibleLINK [doi: http://dx.doi.org/10.1101/030148]

Abstract

Hybridization between humans and Neanderthals has resulted in a low level of Neanderthal ancestry scattered across the genomes of many modern-day humans. After hybridization, on average, selection appears to have removed Neanderthal alleles from the human population. Quantifying the strength and causes of this selection against Neanderthal ancestry is key to understanding our relationship to Neanderthals and, more broadly, how populations remain distinct after secondary contact. Here, we develop a novel method for estimating the genome-wide average strength of selection and the density of selected sites using estimates of Neanderthal allele frequency along the genomes of modern-day humans. We confirm that East Asians had somewhat higher initial levels of Neanderthal ancestry than Europeans even after accounting for selection. We find that there are systematically lower levels of initial introgression on the X chromosome, a finding consistent with a strong sex bias in the initial matings between the populations. We find that the bulk of purifying selection against Neanderthal ancestry is best understood as acting on many weakly deleterious alleles. We propose that the majority of these alleles were effectively neutral-and segregating at high frequency-in Neanderthals, but became selected against after entering human populations of much larger effective size. While individually of small effect, these alleles potentially imposed a heavy genetic load on the early-generation human-Neanderthal hybrids. This work suggests that differences in effective population size may play a far more important role in shaping levels of introgression than previously thought.


Kelley Harris & Rasmus Nielsen, The Genetic Cost of Neanderthal Introgression. BioRxiv 2015 (pre-pub). Freely accessibleLINK [doi: http://dx.doi.org/10.1101/030387]

Abstract

Approximately 2-4% of the human genome is in non-Africans comprised of DNA intro- gressed from Neanderthals. Recent studies have shown that there is a paucity of introgressed DNA around functional regions, presumably caused by selection after introgression. This observation has been suggested to be a possible consequence of the accumulation of a large amount of Dobzhansky-Muller incompatibilities, i.e. epistatic effects between human and Neanderthal specific mutations, since the divergence of humans and Neanderthals approx. 400-600 kya. However, using previously published estimates of inbreeding in Neanderthals, and of the distribution of fitness effects from human protein coding genes, we show that the average Neanderthal would have had at least 40% lower fitness than the average human due to higher levels of inbreeding and an increased mutational load, regardless of the dominance coefficients of new mutations. Using simulations, we show that under the assumption of additive dominance effects, early Neanderthal/human hybrids would have experienced strong negative selection, though not so strong that it would prevent Neanderthal DNA from entering the human population. In fact, the increased mutational load in Neanderthals predicts the observed reduction in Neanderthal introgressed segments around protein coding genes, without any need to invoke epistasis. The simulations also predict that there is a residual Neanderthal derived mutational load in non-African humans, leading to an average fitness reduction of at least 0.5%. Although there has been much previous debate about the effects of the out-of-Africa bottleneck on mutational loads in non-Africans, the significant deleterious effects of Neanderthal introgression have hitherto been left out of this discussion, but might be just as important for understanding fitness differences among human populations. We also show that if deleterious mutations are recessive, the Neanderthal admixture fraction would gradually increase over time due to selection for Neanderthal haplotypes that mask human deleterious mutations in the heterozygous state. This effect of dominance heterosis might partially explain why adaptive introgression appears to be widespread in nature.

October 15, 2015

More evidence supporting very old colonization of Asia by H. sapiens

Quickies

Quite worth mentioning:

Wu Liu et al., The earliest unequivocally modern humans in southern China. Nature 2015. Pay per viewLINK [doi:10.1038/nature15696]

Abstract

The hominin record from southern Asia for the early Late Pleistocene epoch is scarce. Well-dated and well-preserved fossils older than ~45,000 years that can be unequivocally attributed to Homo sapiens are lacking1, 2, 3, 4. Here we present evidence from the newly excavated Fuyan Cave in Daoxian (southern China). This site has provided 47 human teeth dated to more than 80,000 years old, and with an inferred maximum age of 120,000 years. The morphological and metric assessment of this sample supports its unequivocal assignment to H. sapiens. The Daoxian sample is more derived than any other anatomically modern humans, resembling middle-to-late Late Pleistocene specimens and even contemporary humans. Our study shows that fully modern morphologies were present in southern China 30,000–70,000 years earlier than in the Levant and Europe. Our data fill a chronological and geographical gap that is relevant for understanding when H. sapiens first appeared in southern Asia. The Daoxian teeth also support the hypothesis that during the same period, southern China was inhabited by more derived populations than central and northern China. This evidence is important for the study of dispersal routes of modern humans. Finally, our results are relevant to exploring the reasons for the relatively late entry of H. sapiens into Europe. Some studies have investigated how the competition with H. sapiens may have caused Neanderthals’ extinction (see ref. 8 and references therein). Notably, although fully modern humans were already present in southern China at least as early as ~80,000 years ago, there is no evidence that they entered Europe before ~45,000 years ago. This could indicate that H. neanderthalensis was indeed an additional ecological barrier for modern humans, who could only enter Europe when the demise of Neanderthals had already started.

When asked in private correspondence earlier today what did I think of this, I replied that María Martinón (second listed author) is a top expert in tooth morphology and that, if she says they are unmistakably H. sapiens, I have to believe it. 

I also replied a bit more extensively that this should be no surprise, that evidence in favor of a c. 100 Ka BP migration of H. sapiens into South and Southeast Asia has been piling up for some time already. Some of the most important pieces of evidence are the Zhirendong jaw (also from Southern China, dated to c. 100 Ka BP) and the African-like Katoati toolkits (NW India, dated to c. 96 Ka BP). These dates are roughly coincident with the end of the Abbassia Pluvial (c. 125-90 Ka BP), which is in turn coincident with the period of evidence for earliest H. sapiens presence in Arabia and Palestine. 

In other words, our ancestors crossed into Arabia and Palestine (and maybe other less well documented nearby regions of West Asia) around 125 millennia ago (with a second wave c. 90 Ka ago). The Neanderthal admixture episode probably happened soon after. Then they moved to South and SE Asia, quite possibly pressed by growingly arid conditions in Arabia, and this second migration took place around 100 millennia ago (earlier is not yet supported but can't be fully discarded). 

All this has major implications for molecular clock calibration, of course: mtDNA L3 should be c. 125 Ka old and M some 100 Ka old, similarly Y-DNA CF should be around 100 Ka old as well. This is the kind of stuff that makes genetics-oriented people skeptic but the molecular clock is a mere educated hunch, while the archaeological data is serious evidence that cannot be ignored.

July 2, 2014

Altitude-adaption in Tibetans is "Denisovan-like"

It seems that archaic humans left a small but critical legacy among us:

Emilia Huerta Sánchez et al., Altitude adaptation in Tibetans caused by introgression of Denisovan-like DNA. Nature 2014. Pay per viewLINK [doi:10.1038/nature13408] 
Abstract

As modern humans migrated out of Africa, they encountered many new environmental conditions, including greater temperature extremes, different pathogens and higher altitudes. These diverse environments are likely to have acted as agents of natural selection and to have led to local adaptations. One of the most celebrated examples in humans is the adaptation of Tibetans to the hypoxic environment of the high-altitude Tibetan plateau1, 2, 3. A hypoxia pathway gene, EPAS1, was previously identified as having the most extreme signature of positive selection in Tibetans4, 5, 6, 7, 8, 9, 10, and was shown to be associated with differences in haemoglobin concentration at high altitude. Re-sequencing the region around EPAS1 in 40 Tibetan and 40 Han individuals, we find that this gene has a highly unusual haplotype structure that can only be convincingly explained by introgression of DNA from Denisovan or Denisovan-related individuals into humans. Scanning a larger set of worldwide populations, we find that the selected haplotype is only found in Denisovans and in Tibetans, and at very low frequency among Han Chinese. Furthermore, the length of the haplotype, and the fact that it is not found in any other populations, makes it unlikely that the haplotype sharing between Tibetans and Denisovans was caused by incomplete ancestral lineage sorting rather than introgression. Our findings illustrate that admixture with other hominin species has provided genetic variation that helped humans to adapt to new environments.


Figure 3: A haplotype network based on the number of pairwise differences between the 40 most common haplotypes.
The haplotypes were defined from all the SNPs present in the combined 1000 Genomes and Tibetan samples: 515 SNPs in total within the 32.7-kb EPAS1 region. The Denisovan haplotypes were added to the set of the common haplotypes. The R software package pegas23 was used to generate the figure, using pairwise differences as distances. Each pie chart represents one unique haplotype, labelled with Roman numerals, and the radius of the pie chart is proportional to the log2(number of chromosomes with that haplotype) plus a minimum size so that it is easier to see the Denisovan haplotype. The sections in the pie provide the breakdown of the haplotype representation amongst populations. The width of the edges is proportional to the number of pairwise differences between the joined haplotypes; the thinnest edge represents a difference of one mutation. The legend shows all the possible haplotypes among these populations. The numbers (1, 9, 35 and 40) next to an edge (the line connecting two haplotypes) in the bottom right are the number of pairwise differences between the corresponding haplotypes. We added an edge afterwards between the Tibetan haplotype XXXIII and its closest non-Denisovan haplotype (XXI) to indicate its divergence from the other modern human groups. Extended Data Fig. 5a contains all the pairwise differences between the haplotypes presented in this figure. ASW, African Americans from the south western United States; CEU, Utah residents with northern and western European ancestry; GBR, British; FIN, Finnish; JPT, Japanese; LWK, Luhya; CHS, southern Han Chinese; CHB, Han Chinese from Beijing; MXL, Mexican; PUR, Puerto Rican; CLM, Colombian; TSI, Toscani; YRI, Yoruban. Where there is only one line within a pie chart, this indicates that only one population contains the haplotype.


See also this entry on Neanderthal introgression being subject to positive and negative selection.

June 7, 2014

Y-DNA macro-haplogroup K-M526 originated in Indonesia

Most probably did, although there is always some uncertainty. This is what a new study demonstrates almost beyond doubt.

Tatiana M. Karafet et al., Improved phylogenetic resolution and rapid diversification of Y-chromosome haplogroup K-M526 in Southeast Asia, EJHG 2014. Pay per viewLINK [doi:10.1038/ejhg.2014.106]

It also demonstrates that "Australasian" haplogroups M and S, as well as several other K sublineages from that area belong to the same subhaplogroup, "brother" of P and "cousin" of NO. 

The sample, focused in SE Asia and Oceania, is quite massive (4413 K-M526 samples) so there is very limited chance that further studies will produce major changes in this understanding. However there are some geographic blanks like Myanmar which can produce surprises when they are finally properly studied. Mitochondrial DNA from the Bamar (ethnic Burmese) showed in a recent study to have very high top-level diversity, suggesting that their ancestors played some key role in the formation of the peoples of Asia and beyond. 

But while we await for those future studies or even the political chance to perform them, let us see what this excellent paper can tell us.

First of all the new data allows for a re-drawing of the K haplogroup tree, including renaming proposals:


For easier understanding, I annotated in red the new version of the tree with the populations carrying each of the sublineages in SE Asia and Australasia (but excluding island Oceania because of its recent colonization date and simplicity). I also annotated in green the proposed timeline of formation of various nodes downstream of K, per this study:


The presence of so many basal haplogroups and paragroups (signaled with an asterisk) in Island SE Asia makes compulsory to accept that K2 (formerly known as K(xLT) or MNOPS and right now listed in ISOGG as just K) but also its descendants K2b, K2b1 and K2b2 (P) must have originated in what is now the Malay Archipelago but was once a large emerged peninsula known as Sundaland

This is my reconstruction of the likely centroids of K2 sublineages (named) and the K2* paragroup (stars):


The map originally included several work layers in order to analyze the geographical scatter of the downstream haplogroups within K2b but, for visibility reasons, I chose to to make them invisible. 

Instead I made the following map of approximate plausible routes for the various sublineages of K2:


I must say that K-247, labeled as K2e here but reported as close relative of NO in a previous study, which named it "X", and which is found only in India (reported in two men) may add some extra complexity to the K2a (NO) arrow. It is for example possible that K2a'e and P migrated northwards jointly, splitting ways somewhere in Indochina (K2e migrating to India with P1 and maybe some already formed Q remaining in Indochina as well). This matter however requires more investigation and so far other possibilities such as later independent minor flows between South and SE Asia are equally likely.

Although not detailed enough to capture the nuances of the rare basal sublineages found in the various populations of Island SE Asia, this map may be of help for some in order to illustrate the importance of patrilineal haplogroup K-M526 globally:


Overall this study underlies and vindicates my repeated claim of SE Asia playing also an important role in the formation of the Asian+ branch of Humankind, together with South Asia. Something I have repeatedly suggested is that mtDNA macro-haplogroup N appears to have coalesced in SE Asia, while its most prolific "daughter" R instead seems original from South Asia, but that both have left a legacy East and West of the Brahmaputra regional divide. 

I am not sure on how exactly couple mtDNA N/R with the spread of Y-DNA K2 but it seems almost certain that they are related to a great extent. 

I also suspect that the Toba supervolcano catastrophe may well have caused enough damage to allow for a sudden expansion of one or several human populations after it. I would think that the Toba catastrophe marks the beginning of the expansion of Y-DNA K2 and mtDNA N, although it is quite possible that some other lineages like C were also involved in secondary roles in this secondary, yet so influential, expansion in Asia and Oceania.

Another possible element which may have aided this expansion could be dog domestication, which, although so far cannot be documented before 33,000 years ago in Altai, is suspected to have happened first in SE Asia.

May 22, 2014

Autosomal modeling getting closer to archaeological facts by doubling effective mutation rate

Interesting try at autosomal DNA nuclear clock-o-logy. Not quite it yet but interesting nevertheless because it approximates much better what seems to be the reality, based on archaeological data, than previous attempts.

Stephan Schiffels & Richard Durbin, Inferring human population size and separation history from multiple genome sequences. Pre-published at bioRxiv, 2014. Freely accessibleLINK [doi:http://dx.doi.org/10.1101/005348]
Abstract

The availability of complete human genome sequences from populations across the world has given rise to new population genetic inference methods that explicitly model their ancestral relationship under recombination and mutation. So far, application of these methods to evolutionary history more recent than 20-30 thousand years ago and to population separations has been limited. Here we present a new method that overcomes these shortcomings. The Multiple Sequentially Markovian Coalescent (MSMC) analyses the observed pattern of mutations in multiple individuals, focusing on the first coalescence between any two individuals. Results from applying MSMC to genome sequences from nine populations across the world suggest that the genetic separation of non-African ancestors from African Yoruban ancestors started long before 50,000 years ago, and give information about human population history as recently as 2,000 years ago, including the bottleneck in the peopling of the Americas, and separations within Africa, East Asia and Europe.

Based on Figure 4c:

Figure 4: Genetic Separation between population pairs
(...) (c) Comparison of the African/Non-African split with simulations of clean splits. We simulated three scenarios, at split times 50kya, 100kya and 150kya. The comparison demonstrates that the history of relative cross coalescence rate between African and Non-African ancestors is incompatible with a clean split model, and suggests it progressively decreased from beyond 150kya to approximately 50kya. (...)

This comparison reveals that no clean split can explain the inferred progressive decline of relative cross coalescence rate. In particular, the early beginning of the drop would be consistent with an initial formation of distinct populations prior to 150kya, while the late end of the decline would be consistent with a final split around 50kya. This suggests a long period of partial divergence with ongoing genetic exchange between Yoruban and Non-African ancestors that began beyond 150kya, with population structure within Africa, and lasted for over 100,000 years, with a median point around 60-80kya at which time there was still substantial genetic exchange, with half the coalescences between populations and half within (see Discussion). We also observe that the rate of genetic divergence is not uniform but can be roughly divided into two phases. First, up until about 100kya, the two populations separated more slowly, while after 100kya genetic exchange dropped faster. We note that the fact that the relative cross coalescence rate has not reached one even around 200kya (Figure 4c) may possibly be due to later admixture from archaic populations such as Neanderthals into the ancestors of CEU after their split from YRI [29].

Follows their population size estimates:

Figure 3: Population Size Inference from whole genome sequences
(a) Population size estimates from four haplotypes (two phased individuals) from each of 9 populations. The dashed line was generated from a reduced data set of only the Native American components of the MXL genomes. Estimates from two haplotypes for CEU and YRI are shown for comparison as dotted lines.
(...)

A serious problem I have with this graph is that the gradual bottleneck affecting Eurasian-plus populations does not begin to recover within this simulation before c. 40 Ka. That doesn't seem good enough because by that time the Asian population must have expanded at least moderately, as they had colonized all the continent and even Australasia by that date. 

This means that there is a lot of refining still to be done to the methodology, because there should be signal of expansion in Asia much earlier than 40 Ka and not more and more apparent decrease of the population size, what is totally inconsistent with the ongoing colonization of a whole continent. 

I could try to double again the rates to get a more consistent Asian expansion age of c. 80 Ka but that should push the Eurasian-plus bottleneck to a much earlier date, 600 Ka ago, what is simply nonsensical. So the only possible conclusion is that the algorithm is far from realistic and still needs a lot of work.
Non-Bantu East Africans belong to the proto-Eurasian cluster:
Our results suggest that Maasai ancestors were well mixing with Non-African ancestors until about 80kya, much later than the YRI [Yoruba]/Non-African separation. This is consistent with a model where Maasai ancestors and Non-African ancestors formed sister groups, which together separated from West African ancestors and stayed well mixing until much closer to the actual out-of-Africa migration.

South Asians exchanged a lot with West Eurasians before Neolithic:
.... the GIH [Gujarati emigrants to Texas] ancestors remained in close contact with CEU [NW European emigrants to Utah] ancestors until about 10kya, but received some historic admixture component from East Asian populations, part of which is old enough to have occurred before the split of MXL.
Figure 4: Genetic Separation between population pairs
(...) (d) Schematic representation of population separations. Timings of splits, population separations, gene flow and bottlenecks are schematically shown along a logarithmic axis of time. (...)

Overall their population tree makes good sense, except for the apparently too recent dates for nearly all the events and very especially for the intra-Eurasian split. There are no doubt confounding factors acting here. Probably if MXL (Native American component) were excluded, the West-East split could be moved backwards in time.

They heavily rely on the MXL Native American element to calibrate the clock, what makes sense on the surface. But  the fact that Native American origins are themselves a mix of West/South Eurasian and East Asian origins may be tricking them. In the tree, MXL derives from East Asians and it actually should be, we know for a fact, intermediate between East Asia and West/South Eurasia, something that is not reflected at all and that is almost certainly altering the picture.

But, as said above, there are more corners, some quite prominent, to be polished in all the modeling process until a future version of it can be acknowledged as a reliable "clock" (emphasis on reliable, because some people put way too much faith on these rough approximations, what is clearly an error).

On mutation rates:
Our results are scaled to real times using a mutation rate of 1.25×10⁻⁸ per nucleotide per generation, as proposed recently [16] and supported by several direct mutation studies [14-16]. Using a value of 2.5×10⁻⁸ as was common previously [44, 45] would halve the times. This would bring the midpoint of the out-of-Africa separation to an uncomfortably recent 30-40kya, but more concerningly it would bring the separation of Native American ancestors (MXL) from East-Asian populations to 5-10kya, inconsistent with the paleontological record [25, 26].

In short: using the usual scholastic mutation rates would have been nonsensical. Doubling them was common sense needed to achieve minimal coherence with observed reality (how many times have I said that?) It is obviously not enough but it was something needed in any case.

March 29, 2014

Y-DNA R1a spread from Iran

While this conclusion was something more or less reachable with previous data (see HERE for example), a new study adds some fine detail for us to reconstruct the paleohistory of this major Eurasian lineage.

Peter A. Underhill et al., The phylogenetic and geographic structure of Y-chromosome haplogroup R1a. EJHG 2014. Pay per viewLINK [doi:10.1038/ejhg.2014.50]

Important: supplemental materials are freely available.

Abstract

R1a-M420 is one of the most widely spread Y-chromosome haplogroups; however, its substructure within Europe and Asia has remained poorly characterized. Using a panel of 16 244 male subjects from 126 populations sampled across Eurasia, we identified 2923 R1a-M420 Y-chromosomes and analyzed them to a highly granular phylogeographic resolution. Whole Y-chromosome sequence analysis of eight R1a and five R1b individuals suggests a divergence time of ~25 000 (95% CI: 21 300–29 000) years ago and a coalescence time within R1a-M417 of ~5800 (95% CI: 4800–6800) years. The spatial frequency distributions of R1a sub-haplogroups conclusively indicate two major groups, one found primarily in Europe and the other confined to Central and South Asia. Beyond the major European versus Asian dichotomy, we describe several younger sub-haplogroups. Based on spatial distributions and diversity patterns within the R1a-M420 clade, particularly rare basal branches detected primarily within Iran and eastern Turkey, we conclude that the initial episodes of haplogroup R1a diversification likely occurred in the vicinity of present-day Iran.

This case, as well as many others, including that of its close relatives R1b and Q, illustrate why frequency is not the same as origin, which can only be inferred (if at all) by studying the hierarchical diversity of the lineage. These three lineages for example, must have spread from West Asia but they are relatively less important in numbers in that region today, overshadowed by other lineages, notably J. Instead their derived branches had major impacts in other regions (Europe, South and Central Asia, Siberia and America).


Frequencies of the main lineages

There are two main sub-lineages of R1a, which according to the current ISOGG tree version (maybe to be refitted after this study?) are known as R1a1a1b2 (Z93) and R1a1a1b1a (Z282). The first one is essentially Asian (with greatest frequencies in South and Central Asia, where it includes >98% of all R1a individuals) wile the latter is almost exclusively European (notably Eastern European but with a distinct branch in Scandinavia, encompassing together >96% of R1a individuals in Europe).


These maps give us a quite decent glimpse of the main scatter patterns of R1a but alone they can't inform us of its origins. For that we have to look at the detailed tree and the relationship of its samples with geography. 


Origins and distribution of R1a

As mentioned above, the authors conclude that R1a and R1a1 must come from Iran, where the greatest basal diversity is:
To infer the geographic origin of hg R1a-M420, we identified populations harboring at least one of the two most basal haplogroups and possessing high haplogroup diversity. Among the 120 populations with sample sizes of at least 50 individuals and with at least 10% occurrence of R1a, just 6 met these criteria, and 5 of these 6 populations reside in modern-day Iran. Haplogroup diversities among the six populations ranged from 0.78 to 0.86 (Supplementary Table 4). Of the 24 R1a-M420*(xSRY10831.2) chromosomes in our data set, 18 were sampled in Iran and 3 were from eastern Turkey. Similarly, five of the six observed R1a1-SRY10831.2*(xM417/Page7) chromosomes were also from Iran, with the sixth occurring in a Kabardin individual from the Caucasus. Owing to the prevalence of basal lineages and the high levels of haplogroup diversities in the region, we find a compelling case for the Middle East, possibly near present-day Iran, as the geographic origin of hg R1a.

Between these top tier nodes (R1a and R1a1) and the two most common sublineages described above, this study only found one paragroup represented: R1a1a1* (M417). This should be an important step in the analysis but the researchers prefer to remain silent on it. Why? I guess that the reason is that it is complicated to analyze and reach to sound conclusions. 

I spent some time today looking at the haplotypes of this paragroup mentioned in the study and I could not reach a conclusion either: the majority of the sequences are from Europe and all them (excepting a highly derived Norwegian line and including a low derived Iranian one) seem to derive from a North German haplotype. I call this group "branch A". 

However there is at least one West Asian sequence (from Turkey) which seems independent ("branch B"), while an Indian and the already mentioned Norwegian sequence could derive from either one. So my impression is that there is an specifically North European "branch A" but also some other stuff with West Asian centrality ("branch B") within this key paragroup. 

Guess that I could say a lot more about not being able to say much more on this key intermediate step but, synthetically there are two options among which I can't decide:
  • Branch A went back to West Asia from where it spread again to Eastern Europe and Central South Asia.
  • Branch B is actually at the origin of the two derived and highly spread subhaplogroups.
Whatever the case I understand that there are good reasons to think that these spread first from West Asia, at the very least Z93 and very likely also  Z282. 


R1a1a1b2 (Z93)

There is nothing European in this lineage: only some lesser terminal branches at the Southern Urals, roughly where the Kurgan phenomenon began some 6000 years ago. 

This detail is indeed remarkable because, if, as often argued, R1a or some of its subclades spread from there, we should expect at least some basal diversity being retained. Instead all we see are some highly derived branches. So the main conclusion must be that the expansion of R1a does not seem related to the Kurgan phenomenon, except maybe in some secondary instances. 

As mentioned before, this lineage is Central and South Asian and comprises the vast majority of R1a in those two regions. 

The detailed haplotype network can be seen in Supp. Info fig. 2.

In essence we can say that:
  • Z93* has three apparent distinct branches stemming from West Asia (incl. Caucasus) and another one from South Asia/Altai (1). 
  • Z95* has two apparent distinct branches:
    • A small one with presence in West Asia and Southern Europe
    • Another one (pre-M780?) stemming from South or West Asia
  • M780 has clear origins in South Asia (incl. most Roma lineages)
  • Z2125 also appears to originate in South Asia, even if it has a greater spread outside it, notably to Central Asia
  • M580 and M582 appear related and surely originated in West Asia
Weighting them:
  • Z95:
    • West Asia: 2
    • South Asia: 2
    • West/South Asia: 1
Therefore the origin of Z95 should be though as West-South Asian but undecided between either region. Say Afghanistan for example. 
  • Z93:
    • West Asia: 3
    • West/South Asia: 1 (Z95)
    • South Asia/Altai: 1 
In this case I would say that West Asia is almost certainly the origin, although tending to Central/South Asia. For example: Iran again. 

So, regardless of whether the previous stage (M417) represents a stay in West Asia or a back-migration from Europe into West Asia, West Asia is clearly at the origin of Z93. It does not represent any Kurgan migration but an Asian phenomenon with origins towards the West (around Iran).


R1a1a1b1a (Z282)

On first sight this European sublineage seemed quite simpler: it is obvious that the bulk of it spread from Eastern Europe. However, when we look at the haplotype network, we cannot confirm this pattern for the Norwegian or Scandinavian haplogroup Z284, which is only linked to the rest via some South European and West Asian samples. 

So my conclusion must be that Z282 experienced a main expansion from Eastern Europe but only into Eastern and Central Europe and that the Scandinavian variant almost certainly represents another flow within this haplogroup, with the knot being in West Asia. 

Anyhow the main East and Central European expansion seems true. For some reason it is not centered in any obvious prehistorical locality, as could be the Volga or maybe Ukraine, but instead its center is further North around Smolensk. 


Overall reconstruction of the spread of R1a

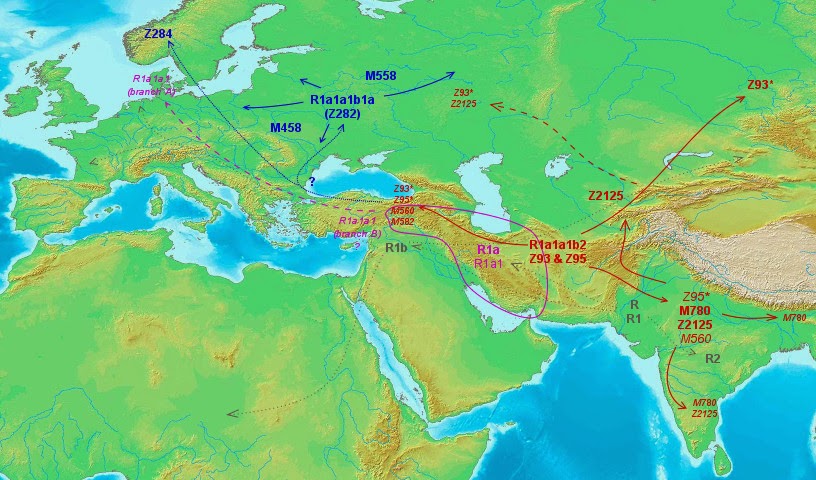
With all the previous analysis I made this map, which also shows in discrete gray color the general pattern of expansion of haplogroup R:


We have an expansion of R into South Asia and Western Eurasia (incl. Central Asia) and even into parts of Africa (R1b-V88) from apparent South Asian (R, R1 and R2) and West Asian (R1a, R1b) origins. Related lineages Q and P* could also be integrated into this pattern of expansion but I did not want to overload the map with too many details. 

There is some uncertainty regarding the North European branches of R1a but otherwise the pattern seems quite clear. 

On these North European branches, I must say that they remind me of other odd lineages with similar geography: R1b-U106, I1-M253 and I2a2-M223. With the likely exception of R1b-U106 neither appears to have experienced any significant re-expansion since their arrival to that corner of the World, however they do seem to survive pretty well in it. 


Time frame?

Finally we seem to be entering the age of full Y chromosome sequencing and a more serious molecular clock based on it. As I have explained on other occasions (for example), the human Y chromosome is large enough to experience mutations almost every single generation, what should provide a decent molecular clock, unlike the very rough approximations used in the past. 

However the issue of correct calibration remains open. As you surely know the academy is slow to incorporate the most recent evidence, especially from fields distinct to their specialty. Hence I do not expect them to calibrate based on the obvious fact that age(CF) or at least age(F)=100,000 years. They are probably still stuck in old concepts of a "recent" out-of-Africa migration c. 60 or at most 80 Ka ago, as well as the usual Pan-Homo spilt under-estimates

I must reckon in any case that I had not enough time to study this matter in depth yet, so the previous observation is rather my idea of what to expect.

In any case in this study the authors resorted to full Y chromosome to calculate their age estimates and I applaud them for doing so. As apparent in fig. 5, all R1 derived sequences have approximately the same number of accumulated SNPs, what in principle allows for a perfected molecular clock, assuming it is well calibrated. 

Their estimate is as follows:
A consensus has not yet been reached on the rate at which Y-chromosome SNPs accumulate within this 9.99Mb sequence. Recent estimates include one SNP per: ~100 years,⁵⁸ 122 years,⁴ 151 years⁵ (deep sequencing reanalysis rate), and 162 years.⁵⁹ Using a rate of one SNP per 122 years, and based on an average branch length of 206 SNPs from the common ancestor of the 13 sequences, we estimate the bifurcation of R1 into R1a and R1b to have occurred ~25,100 ago (95% CI: 21,300–29,000). Using the 8 R1a lineages, with an average length of 48 SNPs accumulated since the common ancestor, we estimate the splintering of R1a-M417 to have occurred rather recently, B5800 years ago (95% CI: 4800–6800). The slowest mutation rate estimate would inflate these time estimates by one third, and the fastest would deflate them by 17%.
The references correspond to (4) Poznick 2013, (5) Francalacci 2013, (58) Xue 2009 and (59) Méndez 2013. This last is the Anzick study, of which at the very least we can say that they had a real calibration point in the ancient Amerindian DNA. It is also the one which provides the longest mutation rate. 

Considering that Xue 2009 is "old" (for this avant-guard aspect of this pretty young science), I find their choice of the Poznick rate quite a bit conservative. The Francalacci rate is the intermediate one of the three "recent" papers referenced and it is also quite close to the calibrated Méndez rate. 

Personally I would choose the later without a second thought. As long as CF ends up being younger than 100 Ka, it is positively too conservative anyhow.

Using the Méndez (Anzick-calibrated) rate of 162 years per SNP, I get the following corrected estimates:
  • R1a/R1b split (R1 node): 33,000 years ago (CI: 26.0-42.5 Ka)
  • R1a-M417 node: 7,700 years ago (CI: 6.4-9.0 Ka)

These seem fair enough to me, judging on the fact that the core R1a expansion seems to originate in West Asia (at the very least for the South/Central Asian branch), what fits much better with a Neolithic frame than with the Kurgan one.

It also fits better with my previous estimates after due re-calibration of Terry D. Robb's full sequence Y-DNA tree, although my estimates are even older, especially after a second recalibration to adjust to the recent discovery of widespread H. sapiens evidence in South and East Asia c. 100 Ka ago

In my understanding the R1 node is actually c. 48 Ka old (R1b: c. 34 Ka.), what, apportioning, yields a date of c. 11.2 Ka for the R1a-M-417 node. 


Update (Mar 31):best possible molecular clock estimates for R1:

Follows fig. 5 of Underhill et al. 2014, annotated by me in red and purple colors:


If I'm correct, then the expansion of R1b in Europe still corresponds in rough terms to the Magdalenian period or, more generally, the late Upper Paleolithic. This does not mean that it remained that way forever (it may well have been reshuffled later on: in the Epipaleolithic, Neolithic and Chalcolithic) but it seems to be the time-frame of its main expansion when the main lineages got established, whatever happened to them later on.

I know well that so far ancient DNA for this lineage remains to be found and that the dominant haplogroup among known Epipaleolithic hunter-gatherers was (for all we know) I2a. However this is what the refined full Y chromosome sequence molecular clock, properly calibrated according to the archaeological evidence for the settling of Asia by H. sapiens, has to say. If you wish to dismiss this and use another estimate instead, that's always up to you. I just hope that you know what you're doing.

Anyhow, if I am correct, then the expansion of R1a is neither Chalcolithic nor Neolithic but clearly Epipaleolithic. Does it make any sense? I can't say for sure because this period is not so well understood. Whatever the case, is it possible to integrate the key pre-Neolithic Zarzian culture of the Zagros (map) in this scheme of things? What about all the other question marks that fill the gaps of our mediocre knowledge of the Mesolithic of West Asia? Or is it the Balcanic Epigravettian to be blamed instead? Or both?

I really can't say with any certainty at this stage. But I am intrigued indeed.


Update (Mar 31): frequency pie charts of Underhill's data available at Kurdish DNA.


Update (Aug 2015): I must update the frequencies of the various upstream paragroups, in agreement with table S4, because I may have missed some details initially. However the overall tendency is the same.

  • R1a* (M420): Italy (1), Turkey East (1), Turkey Cappadocia (2), UAE (1), Oman (1), Iran (set 2) (2), Iran NE (1), Iran South (5), Iran North (5), Azeris-Iran (5).
  • R1a1* (SRY10831.2): Iran (set 2) (1), Iran NE (1), Iran South (2), Iran North (1), Kabardin (1). In addition it has more recently been found in two Epipaleolithic Eastern Europeans (EHG), from Karelia (Haak 2015) and Smolenskaya Oblast (Chekunova 2014).
  • Ra1a1a1* (M417): Ireland (1), Netherlands (3), Norway (1), South Sweden (1), Germany (1), Estonia (1), Hungary (1), Turkey East (Kurds) (1), Iran (set 3) (1), India South (1). 

February 16, 2014

Ancient DNA from Clovis culture is Native American (also Tianyuan affinity mystery)

Figure 4 | [c] (...) maximum likelihood tree. 
A recent study on the ancient DNA of human remains from Anzick (Montana, USA), dated to c. 12,500 calBP, confirms close ties to modern Native Americans, definitely discarding the far-fetched and outlandishly Eurocentric "Solutrean hypothesis" for the origins of Clovis culture (what pleases me greatly, I must admit).

While this fits well with the expectations (at least mine), there is some hidden data that has surprised me quite a bit: it sits at the bottom of a non-discussed formal test graph in which modern populations are compared with both Anzick and Tianyuan (c. 40,000 BP, North China). See below.

Morten Rasmussen et al., The genome of a Late Pleistocene human from a Clovis burial site in western Montana. Nature 2014. Pay per viewLINK [doi:10.1038/nature13025]

Abstract

Clovis, with its distinctive biface, blade and osseous technologies, is the oldest widespread archaeological complex defined in North America, dating from 11,100 to 10,700 14C years before present (bp) (13,000 to 12,600 calendar years bp)1, 2. Nearly 50 years of archaeological research point to the Clovis complex as having developed south of the North American ice sheets from an ancestral technology3. However, both the origins and the genetic legacy of the people who manufactured Clovis tools remain under debate. It is generally believed that these people ultimately derived from Asia and were directly related to contemporary Native Americans2. An alternative, Solutrean, hypothesis posits that the Clovis predecessors emigrated from southwestern Europe during the Last Glacial Maximum4. Here we report the genome sequence of a male infant (Anzick-1) recovered from the Anzick burial site in western Montana. The human bones date to 10,705 ± 35 14C years bp (approximately 12,707–12,556 calendar years bp) and were directly associated with Clovis tools. We sequenced the genome to an average depth of 14.4× and show that the gene flow from the Siberian Upper Palaeolithic Mal’ta population5 into Native American ancestors is also shared by the Anzick-1 individual and thus happened before 12,600 years bp. We also show that the Anzick-1 individual is more closely related to all indigenous American populations than to any other group. Our data are compatible with the hypothesis that Anzick-1 belonged to a population directly ancestral to many contemporary Native Americans. Finally, we find evidence of a deep divergence in Native American populations that predates the Anzick-1 individual.


Haploid DNA

The Y-DNA lineage of Anzick is Q1a2a1* (L54) to the exclusion of the common Native American subhaplogroup Q1a2a1a1 (M3). Among the modern compared sequences that of a Maya is the closest one.

The mtDNA belongs to the common Native American lineage D4h3a at its underived stage (root). 

For starters I must explain that these underived haplotypes can only be found within mtDNA and never in modern Y-DNA (common misconception) because this one accumulates mutations every single generation, while the much shorter mtDNA does only occasionally. Hypothetically we could find the exact ancestor of some modern Y-DNA haplogroup in ancient remains but that would be like finding the proverbial needle in the haystack. On the other hand, finding the underived stage in mtDNA, be it ancient or modern, does not mean that we are before a direct ancestor but just a non-mutated relative of her, who can be very distant in fact.


Autosomal DNA

In this aspect, the Anzick man shows clearly strongest affinities to Native Americans, followed at some distance by Siberian peoples, particularly those near the Bering Strait. 

Figure 2 | Genetic affinity of Anzick-1. a, Anzick-1 is most closely related to Native Americans. Heat map representing estimated outgroup f3-statistics for shared genetic history between the Anzick-1 individual and each of 143 contemporary human populations outside sub-Saharan Africa. (...)

However Anzick-1 shows clearly closer affinity to the aboriginal peoples of Meso, Central and South America (collectively labeled as SA) and less so to those of Canada and the American Arctic (labeled as NA). No data was available from the USA. 

This was pondered by the authors in several competing models of Native American ancestry:

Figure 3 | Simplified schematic of genetic models. Alternative models of the population history behind the closer shared ancestry of the Anzick-1 individual to Central and Southern American (SA) populations than Northern Native American (NA) populations; seemain text for further definition of populations. We find that the data are consistent with a simple tree-like model in which NA populations are historically basal to Anzick-1 and SA. We base this conclusion on two D-tests conducted on the Anzick-1 individual, NA and SA. We used Han Chinese as outgroup. a, We first tested the hypothesis that Anzick-1 is basal to both NA and SA populations using D(Han, Anzick-1; NA, SA). As in the results for each pairwise comparison between SA and NA populations (Extended Data Fig. 4), this hypothesis is rejected. b, Next, we tested D(Han, NA; Anzick-1, SA); if NA populations were a mixture of post-Anzick-1 and pre-Anzick-1 ancestry, we would expect to reject this topology. c, We found that a topology with NA populations basal to Anzick-1 and SA populations is consistent with the data. d, However, another alternative is that the Anzick-1 individual is from the time of the last common ancestral population of the Northern and Southern lineage, after which the Northern lineage received gene flow from a more basal lineage.

The most plausible model they believe is "c", in which Anzick-1 is close to the origin of the SA population, while NA diverged before him. However model "d" in which Anzick-1 is close to the overall Native American root but NA have received further inputs from a mystery population (presumably some Siberians, related to the Na-Dené and Inuit waves) is also consistent with the data. Choosing between both "consistent" models (or something in between) clearly requires further investigation. 


Tianyuan and East Asian origins

All the above is very much within expectations, although refreshingly clarifying. But there is something in the formal tests (extended data fig. 5) that is most unexpected (but not discussed in the paper). 

The formal f3 tests of ED-fig.5 a to e fall all within reasonable expectations. Maybe the most notable finding is that, after all, the pre-Inuit people of the Dorset culture (represented by the Saqqaq remains) left some legacy in Greenland, but they also show some extra affinity with several Siberian populations (notably the Naukan, Chukchi, Koryak and Yukaghir, in this order) before to any other Native Americans, including Aleuts). 

But the really striking stuff is in figs. f and g, where it becomes obvious that the Tianyuan remains of Northern China show not a tad of greater affinity to East Asians (nor to Native Americans) than to West Eurasians. Also two East Asian populations (Tujia and Oroqen) are considerably more distant than the bulk of East Asian peoples to Tianyuan but also to Aznick.

Extended Data Figure 5 | Outgroup f3-statistics contrasted for different combinations of populations. (...) f, g, Shared genetic history with Anzick-1 compared to shared genetic history with the 40,000-year-old Tianyuan individual from China.

This is very difficult to explain, more so as Tianyuan's mtDNA haplogroup B4'5 is part of the East Asian and Native American genetic pool, and the authors make no attempt to do it. 

The previous study by Qiaomei Fu et al. (open access) placed Tianyuan's autosomal DNA near the very root of Circum-Pacific populations (East Asians, Native Americans and Australasian Aborigines) but after divergence from West Eurasians:

From Qiaomei Fu 2013


They even had doubts about the position of Papuans (the only Australasian representation) in that tree, which they suspected an artifact of some sort.

Since I saw that graph (h/t to an anonymous commenter at Fennoscandian Ancestry) I am squeezing my brain trying to figure out a reasonable explanation, considering that the formal f3 test has almost certainly more weight than the ML tree made with an algorithm. 

My first tentative explanation would be to imagine a shared triple-branch origin for Tianyuan, East Asians and West Eurasians, maybe c. 60 Ka ago (it must have been before the colonization of West Eurasia), to the exclusion of other, maybe isolated, ancient populations, whose admixture with the ancestors of the Tujia, Oroqen and Melanesians (maybe via Austronesians?) causes those striking low affinity values for these.

This would be a similar mechanism to the one explaining lower Tianyuan (and generally all ancient Eurasian) affinity for Palestinians (incl. Negev Bedouins) and also the Makrani, who have some African admixture and (in the Palestinian case) also, most likely, residual inputs from the remains of the first Out-of-Africa episode in Arabia.

However to this day we have no idea of which could be those hypothetical ancient isolated populations of East Asia. In normal comparisons such as ADMIXTURE analysis the Tujia and Oroqen appear totally normal within their geographic context, but this may be an artifact of not doing enough runs to reach higher K values, according to the cross-validation test, much more likely to discern the actual realistic components. 

The matter certainly requires further research, which may well open new avenues for the understanding the genesis of Eurasian populations, particularly those from the East.