Showing posts with label SE Asia. Show all posts

March 16, 2018

Ancient genomes of SE Asia

Just a quick mention because I have such a long queue of stuff from Europe that I really have no time to look but very shallowly onto this study, which looks extremely interesting. Credit for the reference to Kristiina.

Hugh McColl, Fernando Racimo, Lasse Vinner, Fabrice Demeter et al., Ancient Genomics Reveals Four Prehistoric Migration Waves into Southeast Asia, BioRXiv (pre-pub) 2018. doi:10.1101/278374

Abstract

Two distinct population models have been put forward to explain present-day human diversity in Southeast Asia. The first model proposes long-term continuity (Regional Continuity model) while the other suggests two waves of dispersal (Two Layer model). Here, we use whole-genome capture in combination with shotgun sequencing to generate 25 ancient human genome sequences from mainland and island Southeast Asia, and directly test the two competing hypotheses. We find that early genomes from Hoabinhian hunter-gatherer contexts in Laos and Malaysia have genetic affinities with the Onge hunter-gatherers from the Andaman Islands, while Southeast Asian Neolithic farmers have a distinct East Asian genomic ancestry related to present-day Austroasiatic-speaking populations. We also identify two further migratory events, consistent with the expansion of speakers of Austronesian languages into Island Southeast Asia ca. 4 kya, and the expansion by East Asians into northern Vietnam ca. 2 kya. These findings support the Two Layer model for the early peopling of Southeast Asia and highlight the complexities of dispersal patterns from East Asia.


February 14, 2016

An archaic human population surviving in SW China until at least 14,000 years ago

Quickies

Just a femur but looks like it. Homo heidelbergensis (Denisovan)?

Darren Curnoe, Xueping Li et al. A Hominin Femur with Archaic Affinities from the Late Pleistocene of Southwest China. PLoS ONE 2015. Open accessLINK [doi:10.1371/journal.pone.0143332]

Abstract

The number of Late Pleistocene hominin species and the timing of their extinction are issues receiving renewed attention following genomic evidence for interbreeding between the ancestors of some living humans and archaic taxa. Yet, major gaps in the fossil record and uncertainties surrounding the age of key fossils have meant that these questions remain poorly understood. Here we describe and compare a highly unusual femur from Late Pleistocene sediments at Maludong (Yunnan), Southwest China, recovered along with cranial remains that exhibit a mixture of anatomically modern human and archaic traits. Our studies show that the Maludong femur has affinities to archaic hominins, especially Lower Pleistocene femora. However, the scarcity of later Middle and Late Pleistocene archaic remains in East Asia makes an assessment of systematically relevant character states difficult, warranting caution in assigning the specimen to a species at this time. The Maludong fossil probably samples an archaic population that survived until around 14,000 years ago in the biogeographically complex region of Southwest China.

Ancient DNA confirms that dogs were first domesticated in Southeast Asia

Quickies

I have already argued for this scenario several times (as opposed to the Neolithic West Asian one, which just makes no sense and rather seems to represent a secondary layer of dog genetics), so I'm very glad that ancient DNA research can confirm it even further.

Guo-Dong Wang, Out of southern East Asia: the natural history of domestic dogs across the world. Cell Research 2015. Open accessLINK [doi:10.1038/cr.2015.147]

Abstract

The origin and evolution of the domestic dog remains a controversial question for the scientific community, with basic aspects such as the place and date of origin, and the number of times dogs were domesticated, open to dispute. Using whole genome sequences from a total of 58 canids (12 gray wolves, 27 primitive dogs from Asia and Africa, and a collection of 19 diverse breeds from across the world), we find that dogs from southern East Asia have significantly higher genetic diversity compared to other populations, and are the most basal group relating to gray wolves, indicating an ancient origin of domestic dogs in southern East Asia 33 000 years ago. Around 15 000 years ago, a subset of ancestral dogs started migrating to the Middle East, Africa and Europe, arriving in Europe at about 10 000 years ago. One of the out of Asia lineages also migrated back to the east, creating a series of admixed populations with the endemic Asian lineages in northern China before migrating to the New World. For the first time, our study unravels an extraordinary journey that the domestic dog has traveled on earth.

I will dare, once again, to challenge the age guesstimates and suggest that they are in fact notably older, maybe even double the proposed age. Notice that I tentatively associate the domestication of dogs with the massive secondary "out of SE Asia" expansion led by Y-DNA haplogroup K2 and mtDNA haplogroup R, which probably took place, at least in my understanding, at some point between the Toba catastrophe (c. 74 Ka BP) and the beginnings of the Upper Paleolithic in Western Eurasia (c. 50 Ka BP), so, yeah, c. 65 or 60 Ka BP is a good age estimate for me, more so considering that we already know of domesticated dogs far from SE Asia, in 33,000 BP.


See also:

October 15, 2015

More evidence supporting very old colonization of Asia by H. sapiens

Quickies

Quite worth mentioning:

Wu Liu et al., The earliest unequivocally modern humans in southern China. Nature 2015. Pay per viewLINK [doi:10.1038/nature15696]

Abstract

The hominin record from southern Asia for the early Late Pleistocene epoch is scarce. Well-dated and well-preserved fossils older than ~45,000 years that can be unequivocally attributed to Homo sapiens are lacking1, 2, 3, 4. Here we present evidence from the newly excavated Fuyan Cave in Daoxian (southern China). This site has provided 47 human teeth dated to more than 80,000 years old, and with an inferred maximum age of 120,000 years. The morphological and metric assessment of this sample supports its unequivocal assignment to H. sapiens. The Daoxian sample is more derived than any other anatomically modern humans, resembling middle-to-late Late Pleistocene specimens and even contemporary humans. Our study shows that fully modern morphologies were present in southern China 30,000–70,000 years earlier than in the Levant and Europe. Our data fill a chronological and geographical gap that is relevant for understanding when H. sapiens first appeared in southern Asia. The Daoxian teeth also support the hypothesis that during the same period, southern China was inhabited by more derived populations than central and northern China. This evidence is important for the study of dispersal routes of modern humans. Finally, our results are relevant to exploring the reasons for the relatively late entry of H. sapiens into Europe. Some studies have investigated how the competition with H. sapiens may have caused Neanderthals’ extinction (see ref. 8 and references therein). Notably, although fully modern humans were already present in southern China at least as early as ~80,000 years ago, there is no evidence that they entered Europe before ~45,000 years ago. This could indicate that H. neanderthalensis was indeed an additional ecological barrier for modern humans, who could only enter Europe when the demise of Neanderthals had already started.

When asked in private correspondence earlier today what did I think of this, I replied that María Martinón (second listed author) is a top expert in tooth morphology and that, if she says they are unmistakably H. sapiens, I have to believe it. 

I also replied a bit more extensively that this should be no surprise, that evidence in favor of a c. 100 Ka BP migration of H. sapiens into South and Southeast Asia has been piling up for some time already. Some of the most important pieces of evidence are the Zhirendong jaw (also from Southern China, dated to c. 100 Ka BP) and the African-like Katoati toolkits (NW India, dated to c. 96 Ka BP). These dates are roughly coincident with the end of the Abbassia Pluvial (c. 125-90 Ka BP), which is in turn coincident with the period of evidence for earliest H. sapiens presence in Arabia and Palestine. 

In other words, our ancestors crossed into Arabia and Palestine (and maybe other less well documented nearby regions of West Asia) around 125 millennia ago (with a second wave c. 90 Ka ago). The Neanderthal admixture episode probably happened soon after. Then they moved to South and SE Asia, quite possibly pressed by growingly arid conditions in Arabia, and this second migration took place around 100 millennia ago (earlier is not yet supported but can't be fully discarded). 

All this has major implications for molecular clock calibration, of course: mtDNA L3 should be c. 125 Ka old and M some 100 Ka old, similarly Y-DNA CF should be around 100 Ka old as well. This is the kind of stuff that makes genetics-oriented people skeptic but the molecular clock is a mere educated hunch, while the archaeological data is serious evidence that cannot be ignored.

September 23, 2015

Which is the correct date for the beginning of the SE Asian Bronze Age

Quickies


According to this new study of Thai sites, the SE Asian Bronze Age, whose dating has been controversial, began probably in the late 2nd millennium BCE and not before.


Charles F.W. Higham et al., A New Chronology for the Bronze Age of Northeastern Thailand and Its Implications for Southeast Asian Prehistory. PLoS ONE 2015. Open accessLINK [doi:10.1371/journal.pone.0137542]

Abstract

There are two models for the origins and timing of the Bronze Age in Southeast Asia. The first centres on the sites of Ban Chiang and Non Nok Tha in Northeast Thailand. It places the first evidence for bronze technology in about 2000 B.C., and identifies the origin by means of direct contact with specialists of the Seima Turbino metallurgical tradition of Central Eurasia. The second is based on the site of Ban Non Wat, 280 km southwest of Ban Chiang, where extensive radiocarbon dating places the transition into the Bronze Age in the 11th century B.C. with likely origins in a southward expansion of technological expertise rooted in the early states of the Yellow and Yangtze valleys, China. We have redated Ban Chiang and Non Nok Tha, as well as the sites of Ban Na Di and Ban Lum Khao, and here present 105 radiocarbon determinations that strongly support the latter model. The statistical analysis of the results using a Bayesian approach allows us to examine the data at a regional level, elucidate the timing of arrival of copper base technology in Southeast Asia and consider its social impact.


Fig 8. Bayesian probability functions (PDFs) for the beginning of the Bronze Age in Thailand.

June 7, 2014

Y-DNA macro-haplogroup K-M526 originated in Indonesia

Most probably did, although there is always some uncertainty. This is what a new study demonstrates almost beyond doubt.

Tatiana M. Karafet et al., Improved phylogenetic resolution and rapid diversification of Y-chromosome haplogroup K-M526 in Southeast Asia, EJHG 2014. Pay per viewLINK [doi:10.1038/ejhg.2014.106]

It also demonstrates that "Australasian" haplogroups M and S, as well as several other K sublineages from that area belong to the same subhaplogroup, "brother" of P and "cousin" of NO. 

The sample, focused in SE Asia and Oceania, is quite massive (4413 K-M526 samples) so there is very limited chance that further studies will produce major changes in this understanding. However there are some geographic blanks like Myanmar which can produce surprises when they are finally properly studied. Mitochondrial DNA from the Bamar (ethnic Burmese) showed in a recent study to have very high top-level diversity, suggesting that their ancestors played some key role in the formation of the peoples of Asia and beyond. 

But while we await for those future studies or even the political chance to perform them, let us see what this excellent paper can tell us.

First of all the new data allows for a re-drawing of the K haplogroup tree, including renaming proposals:


For easier understanding, I annotated in red the new version of the tree with the populations carrying each of the sublineages in SE Asia and Australasia (but excluding island Oceania because of its recent colonization date and simplicity). I also annotated in green the proposed timeline of formation of various nodes downstream of K, per this study:


The presence of so many basal haplogroups and paragroups (signaled with an asterisk) in Island SE Asia makes compulsory to accept that K2 (formerly known as K(xLT) or MNOPS and right now listed in ISOGG as just K) but also its descendants K2b, K2b1 and K2b2 (P) must have originated in what is now the Malay Archipelago but was once a large emerged peninsula known as Sundaland

This is my reconstruction of the likely centroids of K2 sublineages (named) and the K2* paragroup (stars):


The map originally included several work layers in order to analyze the geographical scatter of the downstream haplogroups within K2b but, for visibility reasons, I chose to to make them invisible. 

Instead I made the following map of approximate plausible routes for the various sublineages of K2:


I must say that K-247, labeled as K2e here but reported as close relative of NO in a previous study, which named it "X", and which is found only in India (reported in two men) may add some extra complexity to the K2a (NO) arrow. It is for example possible that K2a'e and P migrated northwards jointly, splitting ways somewhere in Indochina (K2e migrating to India with P1 and maybe some already formed Q remaining in Indochina as well). This matter however requires more investigation and so far other possibilities such as later independent minor flows between South and SE Asia are equally likely.

Although not detailed enough to capture the nuances of the rare basal sublineages found in the various populations of Island SE Asia, this map may be of help for some in order to illustrate the importance of patrilineal haplogroup K-M526 globally:


Overall this study underlies and vindicates my repeated claim of SE Asia playing also an important role in the formation of the Asian+ branch of Humankind, together with South Asia. Something I have repeatedly suggested is that mtDNA macro-haplogroup N appears to have coalesced in SE Asia, while its most prolific "daughter" R instead seems original from South Asia, but that both have left a legacy East and West of the Brahmaputra regional divide. 

I am not sure on how exactly couple mtDNA N/R with the spread of Y-DNA K2 but it seems almost certain that they are related to a great extent. 

I also suspect that the Toba supervolcano catastrophe may well have caused enough damage to allow for a sudden expansion of one or several human populations after it. I would think that the Toba catastrophe marks the beginning of the expansion of Y-DNA K2 and mtDNA N, although it is quite possible that some other lineages like C were also involved in secondary roles in this secondary, yet so influential, expansion in Asia and Oceania.

Another possible element which may have aided this expansion could be dog domestication, which, although so far cannot be documented before 33,000 years ago in Altai, is suspected to have happened first in SE Asia.

February 7, 2014

Mitochondrial lineages from Myanmar

Myanmar, also known as Burma, has been one of those blind spots in the mapping of human genetics. Finally now we get to know something about the peoples of this SE Asian multiethnic state, although there are limitations because the sampling was performed among refugees in Thailand.

Monica Summerer et al., Large-scale mitochondrial DNA analysis in Southeast Asia reveals evolutionary effects of cultural isolation in the multi-ethnic population of Myanmar. BMC Evolutionary Biology 2014. Open accessLINK [doi:10.1186/1471-2148-14-17]

Abstract

Background

Myanmar is the largest country in mainland Southeast Asia with a population of 55 million people subdivided into more than 100 ethnic groups. Ruled by changing kingdoms and dynasties and lying on the trade route between India and China, Myanmar was influenced by numerous cultures. Since its independence from British occupation, tensions between the ruling Bamar and ethnic minorities increased.

Results

Our aim was to search for genetic footprints of Myanmar’s geographic, historic and sociocultural characteristics and to contribute to the picture of human colonization by describing and dating of new mitochondrial DNA (mtDNA) haplogroups. Therefore, we sequenced the mtDNA control region of 327 unrelated donors and the complete mitochondrial genome of 44 selected individuals according to highest quality standards.

Conclusion

Phylogenetic analyses of the entire mtDNA genomes uncovered eight new haplogroups and three unclassified basal M-lineages. The multi-ethnic population and the complex history of Myanmar were reflected in its mtDNA heterogeneity. Population genetic analyses of Burmese control region sequences combined with population data from neighboring countries revealed that the Myanmar haplogroup distribution showed a typical Southeast Asian pattern, but also Northeast Asian and Indian influences. The population structure of the extraordinarily diverse Bamar differed from that of the Karen people who displayed signs of genetic isolation. Migration analyses indicated a considerable genetic exchange with an overall positive migration balance from Myanmar to neighboring countries. Age estimates of the newly described haplogroups point to the existence of evolutionary windows where climatic and cultural changes gave rise to mitochondrial haplogroup diversification in Asia.

The main sampled ethnic group are the Karen, who live at the border with Thailand, but the Bamar or Burmans, the largest ethnic group, were also sampled in big numbers. 

Fig. 2.- Origin of samples and mitochondrial haplogroup distribution of Southeast Asian populations. Although most of the study participants originated from Karen State (red), a broad sample spectrum from nearly all divisions and states of Myanmar (a) was included in this study. b shows the haplogroup distributions of populations from Myanmar and four other Southeast Asian regions. In the white insert box the haplogroup heterogeneity of two ethnic groups of Myanmar is illustrated. The hatched area in the map surrounding the border between Myanmar and Thailand shows the main population area of the Karen people. The Bamar represent the largest ethnic group (68%) in Myanmar. The size of the pie diagrams corresponds to sample size.

The smaller samples are only detailed in the supplementary data for what I have seen, so I will not discuss them right now (maybe in an update?). 

Overall all SE Asians including the Southern Han from Hong-Kong appear similar in broad terms. Excepted Laos, this relative similitude is quite apparent in figure 3:

Fig. 3.- Multi-dimensional scaling plot of pairwise Fst-values and haplogroup distribution of populations from Myanmar and 12 other Asian regions. A distinct geographic pattern appeared in the multi-dimensional scaling plot (Stress = 0.086; R2 = 0.970) of pairwise Fst-values: The Myanmar sample fitted very well within the Southeast Asian cluster, the Central Asian populations formed a second cluster, the Korean sample represented East Asia, the Afghanistan population was representative for South Asia and Russia symbolized Western Eurasia. The main haplogroup distributions are displayed as pie charts. The size of the pie diagrams corresponds to sample size. The proportion of N-lineages (without A,B and R9’F) increases from very low percentages in Southeast and East Asia over 50% in Central Asia to more than 75% in Afghanistan and 100% in the sample of Russian origin. The proportion of the American founding haplogroups A,B,C and D displayed an interesting pattern: from inexistent in Russians it increased to more than 50% in East Asian Korea.

Looking at the particular differences in haplogroup frequencies, I'd say that the Thai are quite unremarkable, while the other populations show some peculiarities:
  • Karen: higher frequencies of R9/F, A, C and G
  • Bamar: much higher M* (and extremely diverse)
  • Laotian: higher frequencies of B and M7
  • Vietnamese: more B and N*
  • South Han (Hong-Kong): more D

It is very notable the high diversity of paragroup M* among the Bamar. The authors notice that not more than three individuals shared each different subhaplogroup, what points to a very high diversity within haplogroup M. I don't have time right now to ponder the various lineages, some of which are newly described, but I probably will in the future, because, together with the high diversity in NE India, they have the potential of shifting the paradigm of Asian colonization by H. sapiens a bit towards the East.

The various M* and other novel haplogroups described in Myanmar is shown in fig. 4. Haplogroups M90 and M91 are new basal M sublineages, along with three other unnamed private lineages, which also appear as basal. Also M20a, M49a and G2b1a are new sublineages further downstream. Within N/R, another newly described lineage is B6a1.

The Bamar are extremely diverse not just within M*:
... the haplogroup composition of Bamar was exceptionally diverse with 80 different haplogroups and a maximum of 6 samples in the same haplogroup (Figure 4).

On the other hand, the Karen show the signs of genetic isolation instead, with large concentrations in the same haplogroups.

Interestingly, the authors think that rather than being a receiver, Myanmar was a major source of population to its neighbors:
Migration analyses of Myanmar and four Southeast Asian regions displayed a vivid exchange of genetic material between the countries and demonstrated a strong outwards migration of Myanmar to all analyzed neighboring regions (for details see Additional file 4: Table S4).

This influence is most intense to Laos, Thailand and South China, while things are more balanced regarding Vietnam instead.

June 8, 2013

Sago trees were important in Neolithic Guangxi

What did SE Asians eat before the spread of rice farming?

Xiaoyan Yang et al., Sago-Type Palms Were an Important Plant Food Prior to Rice in Southern Subtropical China. PLoS ONE 2013. Open accessLINK [doi:10.1371/journal.pone.0063148]

Abstract

Poor preservation of plant macroremains in the acid soils of southern subtropical China has hampered understanding of prehistoric diets in the region and of the spread of domesticated rice southwards from the Yangtze River region. According to records in ancient books and archaeological discoveries from historical sites, it is presumed that roots and tubers were the staple plant foods in this region before rice agriculture was widely practiced. But no direct evidences provided to test the hypothesis. Here we present evidence from starch and phytolith analyses of samples obtained during systematic excavations at the site of Xincun on the southern coast of China, demonstrating that during 3,350–2,470 aBC humans exploited sago palms, bananas, freshwater roots and tubers, fern roots, acorns, Job's-tears as well as wild rice. A dominance of starches and phytoliths from palms suggest that the sago-type palms were an important plant food prior to the rice in south subtropical China. We also believe that because of their reliance on a wide range of starch-rich plant foods, the transition towards labour intensive rice agriculture was a slow process.

March 16, 2013

Another SE Asian genetic adaption to Malaria

Malaria has been one of the greatest challenges to human survival in the tropics and subtropical areas, which make up the bulk of our early distribution as species. In response we have developed a number of genetic-biological strategies of which the best known is the allele that causes the sickle cell disease in homozygotes but protects heterozygotes against the deadly infection in a clear example of balancing selection. This is not however the only adaption against malaria.

A new study explores a SE Asian (including Southern Chinese) adaption that also seems to be a way to fight against the disease, which is a variant of Alpha-Thalassemia:

Qin-Wei Qiu et al., Evidence of recent natural selection on the Southeast Asian deletion (--SEA) causing alpha-thalassemia in South China. BMC Evolutionary Biology 2013. Open access → LINK [doi:10.1186/1471-2148-13-63]

Abstract (provisional)


Background

The Southeast Asian deletion (--SEA) is the most commonly observed mutation among diverse alpha-thalassemia alleles in Southeast Asia and South China. It is generally argued that mutation --SEA, like other variants causing hemoglobin disorders, is associated with protection against malaria that is endemic in these regions. However, little evidence has been provided to support this claim.

Results

We first examined the genetic imprint of recent positive selection on the --SEA allele and flanking sequences in the human alpha-globin cluster, covering a genomic region spanning ~410 kb, by genotyping 28 SNPs in a Chinese population consisting of 76 --SEA heterozygotes and 138 normal individuals. The pattern of linkage disequilibrium (LD) and the long-range haplotype test revealed a signature of positive selection. The network of inferred haplotypes suggested a single origin of the --SEA allele.

Conclusions

Thus, our data support the hypothesis that the --SEA allele has been subjected to recent balancing selection, triggered by malaria.


See also:

October 28, 2012

The genetic and phenotype complexity of the Oceanic language area

In this entry, rather than discussing Polynesians alone, which seem to be just the tip of the Eastern Austronesian iceberg, I'll try to understand here the complexity of speakers of Oceanic languages, the main native language family of Island Oceania. 

Oceanic is a branch of Austronesian but for the purposes of this entry we will only mention other Austronesian peoples/languages tangentially. The focus is Oceanic because we can't understand the parts without the whole here most probably. 


Linguistics

Oceanic languages are scattered as follows:

  Admiralties and Yapese
  St Matthias
  Western Oceanic and Meso-Melanesian (two distinct sub-families)
  Temotu
  Southeast Solomons
  Southern Oceanic
  Micronesian
  Fijian–Polynesian
Black enclosed zones are pockets of languages from other families.
(CC by kwami)

It is certainly interesting that Micronesian and Fijian-Polynesian seem to be particularly related among them. Instead the Western Oceanic and Admiralty subfamilies (both from the islands near Papua) seem to have separated early on or diverged farther for whatever other reasons (stronger substrate influence for example).


Prehistory

Lapita pot from Tonga (source)
As I cited recently, Polynesians seem to have spread from Society Islands in the 1190-1290 CE window. The genesis of the Micronesian family is not well understood... but the overall genesis of Oceanic languages seems to be at the Lapita culture, which spread through Island Melanesia (excluding Papua) and some nearby islands (notably Tonga and Samoa - also Marquesas c. 300 CE(ref)).

Early Lapita culture is dated to c. 1350-750 BCE, while a Late phase is dated to c. 250 BCE, spreading to the Solomon Islands, which show no indications of the earlier period (Ricaut 2010, fig. 2).

So a simplified chronology for Oceanic expansion would be
  1. Lapita culture from near Melanesia to Vanuatu and Kanaky (New Caledonia), then to:
    1. Fiji, Samoa and Tonga since c. 900 BCE
    2. Solomon Is. c. 250 BCE
  2. Arrival to Society Islands (Tahiti, etc.) c. 300-800 CE from maybe Samoa.
  3. Main Polynesian expansion to the farthest islands (Hawaii, Rapa Nui, Aotearoa-NZ) c. 1200 CE from Society Is.

Phenotype ('race')

A classical and unavoidable element in the ethnographic division of the region is phenotype, appearance (i.e. 'race'). Since the first European arrival to the area the division between black Melanesians and white Polynesians (very relative as we will see now) has been part of all our conceptualizations of the region. 

Conscious of that and wanting to get a better impression I collected from the Internet what I estimate may be representative faces from the Oceanic linguistic zone and nearby areas (other Austronesians and Melanesians) and put them on a map:

Click to expand

A relatively homogeneous Polynesian phenotype can be identified and one can imagine that it stems from the area of Samoa-Tonga, considering the previous prehistorical review. But otherwise the diversity, gradations and abundance of local uniqueness seems quite impressive.

Based on other cases, one would imagine also that phenotype differences would be coincidental with genetic ones. However this is not too easy to discern, partly because Polynesians have strong founder effects that blur the matter, partly because there is no obvious strict dividing line between the various phenotypes and partly because of the insistence of some in considering Lapita as a Polynesian phenomenon, when it is obviously an Oceanic one, including and emphasizing the Melanesian side of the diverse Oceanic landscape, of which the Polynesian-Micronesian branch is just one element (famous and extended but not the core). 


Genetics

The main Y-DNA lineage among Polynesians is C2a1 (P33), not found outside Polynesia senso stricto but reaching there frequencies of 63-90% (excepted Tonga where it's only 33%). This is a clear founder effect in this population.

C subclades in SE Asia and Oceania
(from Karafet 2010, annotated with ISOGG nomenclature)


C2a1 is clearly derived from a Melanesian superset C2a (M208) still found as C2a(xC2a1) at low frequencies in Samoa (8%) and Tahiti (4%) but also in Vanuatu (2%) and coastal Papua (13%). C2a establishes a probably genetic link of Polynesians with Lapita culture and Melanesian peoples in general.

An earlier pylogenetic stage is C2 (M38), which is probably in the region since the very first colonization process some 50 thousand years ago (or maybe even earlier). C2(xC2a) is most common in Wallacea (East Indonesia, East Timor), where it reaches maybe figures of 33% on average. It is however also found in highland Papua (13%) and Vanuatu (20%) but as it is most doubtful that C2a evolved as recently as Lapita times, we should really focus on C2a as such rather than the wider C2, which only seems to confuse the matter.

The lack of C2(xC2a) in most of the Oceanic languages' area clearly indicates that the expansion (and subsequent founder effects) did not begin in Wallacea but in  Melanesia, at least in what regards to C sublineages.

The other major Polynesian haplogroup is O3a2 (P201), which would seem to have originated in Philippines and maybe arrived there via Micronesia:

O3 subclades in SE Asia and Oceania
(from Karafet 2010, annotated with ISOGG nomenclature)

Melanesian populations also sport some lineages that are not common among other Oceanic-speaker peoples, notably K, M and S. However they are irregularly shared with Wallacea (Eastern Indonesia, East Timor). Like C2 these lineages coalesced in the region soon after colonization by Homo sapiens.

In the motherly side of things genetic, the absolutely dominant mtDNA lineage among Polynesians (the so-called Polynesian motif) is B4a1a1, which ultimately stems from East or rather SE Asia. However it probably arrived to the region (again) via Melanesia, albeit maybe somewhat tangentially.
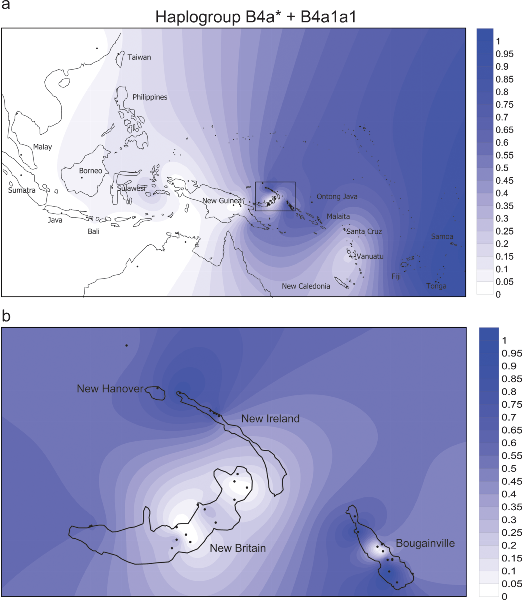
From Friedlander 2007 (fig. 4)
Spatial frequency distribution of haplogroup B4a* and B4a1a1 in Island Southeast Asia and the western Pacific, created using the Kriging algorithm of the Surfer package of haplogroups. Figure 4b presents the detailed distribution for Northern Island Melanesia. Data details are provided in table S3.

The matrilineal Polynesian motif does offer a possible pattern of settlement, maybe related specifically to Late Lapita, that could allow us to understand the possible origin of the phenotype differences between Melanesians and Polynesians, as could do the Y-DNA lineage O3a2. However there are lots of remnants of quite strictly Melanesian Early Lapita, as is evident by the (Y-DNA) C2a lineages retained so strongly among Polynesians within their own founder effects, whose importance we cannot afford to dismiss.

Other mtDNA lineages like Q1 or M27 are of relevance in Melanesian populations. Q1 did make its way into some Polynesian populations but as minority lineage only.


Update (Oct 31):

Terry in the comments sections grunts a lot but now and then provides useful complementary data, for example this Y-DNA map of the region from Kayser 2006:


Kayser 2006 - fig. 1
Frequency distribution of (A, B) NRY and (C, D) mtDNA haplogroups found in Polynesia with a genetic origin in (A, C) Asia or (B, D) Melanesia.

As is apparent since Kayser's publication (if not before), the Melanesian patrilineages are much more common (actually dominant) among Polynesians than the matrilineages from the same origin, what is attributable to a founder effect related to the Lapita culture.

Another interesting reference is this Y-DNA map of Papua (New Guinea) and some nearby islands (from Mona 2007):

Mona 2007 FIG. 2.—Y-chromosome haplogroups and their frequencies in populations from the Bird’s Head region and elsewhere in New Guinea. Data from other populations of New Guinea were used from previous studies (Kayser et al. 2003, 2006). Size of the pie charts is according to sample size of the groups. Abbreviations are as in supplementary table S1, Supplementary Material online.


Both maps and/or the data in the relevant papers provide key information on possible origins for the C2a-M208 patrilineal founder effect, so important in general in the Oceanic peoples and specially the Polynesian branch. The exact origin cannot be pinpointed without further research (or maybe not at all) but it's clear that C2a-M208 only exists from Papua (New Guinea) to the East, so it must have a Melanesian origin be it Papuan or from the nearby islands.


Bibliography
  • François-Xavier Ricaut et al., Ancient Solomon Islands mtDNA: assessing Holocene settlement and the impact of European contact. Journal of Archaeological Science, 2010 ··> LINK (PDF).
  • Jonathan S. Friedlaender et al., Melanesian mtDNA Complexity. PLoS ONE, 2007 ··> LINK (open access).
  • Tatiana Karafet et al., Major East-West Division Underlies Y Chromosome Stratification Across Indonesia. MBE 2010 ··> LINK (free access).
  • Michael Knapp et al., Complete mitochondrial DNA genome sequences from the first New Zealanders. PNAS 2012 ··> LINK (open access).
  • Manfred Kayser et al., Melanesian and Asian Origins of Polynesians: mtDNA and Y Chromosome Gradients Across the Pacific. MBE 2006 ··> LINK (open access).
  • Stephano Mona et al., Patterns of Y-Chromosome Diversity Intersect with the Trans-New Guinea Hypothesis. MBE 2007 ··> LINK (free access).

_________________________________________________________________________________
Note: updates after first posted version in maroon color.

October 25, 2012

IL-4 genetic combo protects Indian hunter-gatherers from Malaria

Or, more precisely, protects many of those who have it in diverse populations but it is most concentrated among hunter-gatherers of the so-called Ancestral Tribal Populations (ATP).

Aditya Nath Jha et al., IL-4 Haplotype -590T, -34T and Intron-3 VNTR R2 Is Associated with Reduced Malaria Risk among Ancestral Indian Tribal Populations. PLoS ONE 2012. Open access ··> LINK [doi:10.1371/journal.pone.0048136]

Abstract

Background

Interleukin 4 (IL-4) is an anti-inflammatory cytokine, which regulates balance between TH1 and TH2 immune response, immunoglobulin class switching and humoral immunity. Polymorphisms in this gene have been reported to affect the risk of infectious and autoimmune diseases.
Methods

We have analyzed three regulatory IL-4 polymorphisms; -590C>T, -34C>T and 70 bp intron-3 VNTR, in 4216 individuals; including: (1) 430 ethnically matched case-control groups (173 severe malaria, 101 mild malaria and 156 asymptomatic); (2) 3452 individuals from 76 linguistically and geographically distinct endogamous populations of India, and (3) 334 individuals with different ancestry from outside India (84 Brazilian, 104 Syrian, and 146 Vietnamese).

Results
The -590T, -34T and intron-3 VNTR R2 alleles were found to be associated with reduced malaria risk (P<0.001 for -590C>T and -34C>T, and P = 0.003 for VNTR). These three alleles were in strong LD (r2>0.75) and the TTR2 (-590T, -34T and intron-3 VNTR R2) haplotype appeared to be a susceptibility factor for malaria (P = 0.009, OR = 0.552, 95% CI = 0.356 –0.854). Allele and genotype frequencies differ significantly between caste, nomadic, tribe and ancestral tribal populations (ATP). The distribution of protective haplotype TTR2 was found to be significant (χ23 = 182.95, p-value <0.001), which is highest in ATP (40.5%); intermediate in tribes (33%); and lowest in caste (17.8%) and nomadic (21.6%).
Conclusions

Our study suggests that the IL-4 polymorphisms regulate host susceptibility to malaria and disease progression. TTR2 haplotype, which gives protection against malaria, is high among ATPs. Since they inhabited in isolation and mainly practice hunter-gatherer lifestyles and exposed to various parasites, IL-4 TTR2 haplotype might be under positive selection.

The protection is not absolute but it holds very strong statistical significance for the R2-R3 heterozygous combo, as shown in fig. 1:


Figure 1. Distribution of IL-4 intron-3 VNTR polymorphism.
A and B: genotype and allelic distribution between malaria case control groups, respectively; C and D: genotype and allelic distribution among caste, nomadic, tribe and ancestral tribe, respectively.


Combo that is most common (near-optimal distribution) among the ATPs. The correlation holds for the four linguistic families with variations being more a matter of individual ATP tribes: from 35% among the AoNaga (TB, Nagaland) to 67% among the Baiga (IE, Madhya Pradesh) or 63% among the Onge (Jarawa-Onge, Andaman Is.)
 
See also:

September 27, 2012

Neolithic 'calendar' found in Vietnam

The artifact, marked with ordered dots and strips that may well represent the lunar cycle, was found in Nguom Hau Cave (Na Hang District, Tuyên Quang province, Northern Vietnam). 

A similar artifact was discovered in 1985 not far away: Na Cooc Cave (Thái Nguyên province). 

The calendar has been estimated to be from c. 4000 years ago. 

The stone tool was found in a tomb marked with 14 large stones laid at a length of 1.6m. Bones were found under the stones but no skull was found, with Chung guessing that the skull may have decayed due to the humidity in the cave.

A number of other stone tools were buried with the corpse.

The dig also produced much other information from the Iron Age (3.0-3.5 Ka BP), Late Neolithic (4.0-4.3 Ka BP) and a deeper and very thick Early Neolithic layer consisting of many polished stone axes and other tools.

Together with other findings, the evidence mounts for inhabitation from at least 8000 years ago in this area. 

Source: Viêt Nam News (via Pileta).

September 20, 2012

Beautiful polished axe from Arunachal Pradesh

From the Archaeology Network:


A prehistoric tool of Neolithic period has been found in Taksing under Upper Subansiri district, bordering China.


The Neolithic axe-head found at Taksing [Credit: Arunachal Front]
Tade Ebo, Taksing  CCR evangelist and one Talin Rigia handed over the axe-shaped Neolithic tool to research director Dr. Tage Tada on September 12, which is now on display in the Itafort Archaeological Museum here.

The tool is of rectangular in shaped and made out of diorite black stone. Both the surfaces are fully grounded and finely polished but a few sears are seen in the lateral margin of the tool. The cutting edge very sharp, convex and bifacially beveled. The shape, size and workmanship of the tool indicate that it was used as axe by the people in the Neolithic age, most probably for the purpose of agriculture and farming.

Tada informed that this was the first finding from the remote Indo-China (Tibet) border. “The possession of the tool will provide opportunity to the students of archaeology of the state for its further investigation and add definite information on the prehistoric period of the area”, he added.

The Director further said that in Arunachal Pradesh, local people believe such prehistoric tools possess certain sprits. Some believe that such object comes from sky while other believes that such tools are used by the malevolent sprit. “In Taksing the local Nah and Tagin people believe that this has fallen from sky used by malevolent sprits, thus they are very scared of touching the artifact.”

Source: Arunachal Front [September 16, 2012]

______________________________________________

Geographical and anthropological note: Arunachal Pradesh is effectively administrated by India as state but also claimed by China (via its annexation of Tibet). For what I care it belongs to its own peoples, a diverse array of mostly Tibeto-Burman ethnicities. From an anthropological viewpoint the whole region so-called NE India (between Bangla Desh and Burma is transitional between South Asia and SE Asia.

September 5, 2012

The other red cell disease that protects against the other malaria

Oval red cells
(CC The New Messiah)
It is generally well known that the sickle-cell disease, relatively common in parts of Africa, or rather its associated allele when heterozygous, has a protective effect against malaria, specifically to the variant caused by Plasmodium falciparium.

But there is at least another adaption to another kind of malaria: the one caused by P. vivax. This one, the SE Asian ovalocytosis (SAO), has only been discovered and studied in the last years and seems to exist only in some populations of Malaysia and Papua. This study confirms that the SAO defect effectively protects against P. vivax.

Ana Rosanas Urgell et al., Reduced Risk of Plasmodium vivax Malaria in Papua New Guinean Children with Southeast Asian Ovalocytosis in Two Cohorts and a Case-Control Study. PLoS Medicine 2012. Open access ··> LINK [doi:10.1371/journal.pmed.1001305] 

Abstract


Background

The erythrocyte polymorphism, Southeast Asian ovalocytosis (SAO) (which results from a 27-base pair deletion in the erythrocyte band 3 gene, SLC4A1Δ27) protects against cerebral malaria caused by Plasmodium falciparum; however, it is unknown whether this polymorphism also protects against P. vivax infection and disease.

Methods and Findings

The association between SAO and P. vivax infection was examined through genotyping of 1,975 children enrolled in three independent epidemiological studies conducted in the Madang area of Papua New Guinea. SAO was associated with a statistically significant 46% reduction in the incidence of clinical P. vivax episodes (adjusted incidence rate ratio [IRR] = 0.54, 95% CI 0.40–0.72, p<0.0001) in a cohort of infants aged 3–21 months and a significant 52% reduction in P. vivax (blood-stage) reinfection diagnosed by PCR (95% CI 22–71, p = 0.003) and 55% by light microscopy (95% CI 13–77, p = 0.014), respectively, in a cohort of children aged 5–14 years. SAO was also associated with a reduction in risk of P. vivax parasitaemia in children 3–21 months (1,111/µl versus 636/µl, p = 0.011) and prevalence of P. vivax infections in children 15–21 months (odds ratio [OR] = 0.39, 95% CI 0.23–0.67, p = 0.001). In a case-control study of children aged 0.5–10 years, no child with SAO was found among 27 cases with severe P. vivax or mixed P. falciparum/P. vivax malaria (OR = 0, 95% CI 0–1.56, p = 0.11). SAO was associated with protection against severe P. falciparum malaria (OR = 0.38, 95% CI 0.15–0.87, p = 0.014) but no effect was seen on either the risk of acquiring blood-stage infections or uncomplicated episodes with P. falciparum. Although Duffy antigen receptor expression and function were not affected on SAO erythrocytes compared to non-SAO children, high level (>90% binding inhibition) P. vivax Duffy binding protein–specific binding inhibitory antibodies were observed significantly more often in sera from SAO than non-SAO children (SAO, 22.2%; non-SAO, 6.7%; p = 0.008).

Conclusions

In three independent studies, we observed strong associations between SAO and protection against P. vivax malaria by a mechanism that is independent of the Duffy antigen. P. vivax malaria may have contributed to shaping the unique host genetic adaptations to malaria in Asian and Oceanic populations.

August 21, 2012

Ancient Homo sapiens from Laos (46-63,000 years ago)

Tam-Pa-Ling skull
While this is not the only nor even probably the oldest remain of the so-called anatomically modern humans (i.e. Homo sapiens, our kin) in Eastern or SE Asia, it seems to be the less controversial one so far, what should help to consolidate our knowledge of the period of colonization of the Eurasian region East of Bengal.

Fabrice Demeter et al., Anatomically modern human in Southeast Asia (Laos) by 46 ka. PNAS 2012. Pay per view (6 months embargo) ··> LINK [doi:10.1073/pnas.1208104109]

Abstract

Uncertainties surround the timing of modern human emergence and occupation in East and Southeast Asia. Although genetic and archeological data indicate a rapid migration out of Africa and into Southeast Asia by at least 60 ka, mainland Southeast Asia is notable for its absence of fossil evidence for early modern human occupation. Here we report on a modern human cranium from Tam Pa Ling, Laos, which was recovered from a secure stratigraphic context. Radiocarbon and luminescence dating of the surrounding sediments provide a minimum age of 51–46 ka, and direct U-dating of the bone indicates a maximum age of ∼63 ka. The cranium has a derived modern human morphology in features of the frontal, occipital, maxillae, and dentition. It is also differentiated from western Eurasian archaic humans in aspects of its temporal, occipital, and dental morphology. In the context of an increasingly documented archaic–modern morphological mosaic among the earliest modern humans in western Eurasia, Tam Pa Ling establishes a definitively modern population in Southeast Asia at ∼50 ka cal BP. As such, it provides the earliest skeletal evidence for fully modern humans in mainland Southeast Asia.

Some more details can be found at the press release by the University of Illinois (h/t Pileta).

There are some skulls and skull fragments from East Asia that can be actually older than this one but they may be less straightforward either in their dating or their identification as Homo sapiens:

  • Liujiang skull (at Don's Maps, at P. Brown's site, at Bradshaw Foundation), from Guangxi-Zhuang, is clearly a modern Homo sapiens but the exact date is not known because it was originally dug with very limited means. Recent datings of nearby sediment suggest an age of 68-139 Ka but this is hotly debated.
  • Zhirendong jaw (at this blog, at PhysOrg), also from Guangxi-Zhuang and dated to before 100,000 years ago (110,000 years ago according to first reports), is argued to be a modern Homo sapiens but its very ancient date and some unavoidable ambiguity of such limited skeletal evidence allow for some skepticism, if you are so inclined.
  • Callao cave metatarsal (foot) bone (at Leherensuge) is dated to before 67,000 years ago and comes from Luzon, the largest Filipino island, but because of its small size cannot be ascribed to any human species safely. All we can say is that they knew how to use rafts or boats - but then Homo floresiensis (H. erectus?) did too. 
  • Also some non-skeletal evidence to consider:

Whichever is your personal take, it is clear that this skull adds up in support of a very old colonization of East Asia. The question is: exactly how old?


Update: a creative reconstruction by H. Zänder:

July 26, 2012

Ancient DNA... of chickens

Sure, why not?

Alice A. Storey, Investigating the Global Dispersal of Chickens in Prehistory Using Ancient Mitochondrial DNA Signatures. PLoS ONE, 2012. Open access ··> LINK [DOI: 10.1371/journal.pone.0039171]

The authors managed to produce more or less reliable mtDNA haplotypes for 48 remains of historical and prehistorical chickens from Thailand, Pacific Islands, Latin America (a pre-Columbian site in Chile but post-Columbian sites elsewhere) and (medieval) Spain.

Excepting the oldest Thai haplotype, all them belonged to haplogroups D and E, as follows:

Fig. 1
In spite of the authors burying most of the relevant data in the supplemental material, I was able to conclude that the ancient haplotypes (ah) above mean in terms of samples:

  • Haplogroup E:
    • cluster 1:
      • ah1 Pacific Is. (n=1)
      • ah2 Pacific Is. (n=4), Thailand (n=1), Chile (n=1)
      • ah6 Peru (n=1)
    • cluster 2:
      • ah3 Pacific Is. (n=10), Chile (n=2), Spain (n=3), Haiti (n=1), Florida (n=1)
      • ah4 Spain (n=1)
      • ah5 Bolivia (n=3)
      • ah7 Spain (n=1)
  • Haplogroup D:
      • ah9 Pacific Is. (n=1), Peru (n=1)
    • cluster 3:
      • ah10 Pacific Is. (n=14)
      • ah11 Pacific Is. (n=1)
  • Haplogroup B (not shown):
      • ah12 Thailand (n=1)
There is no ah8 apparently. 

It must be noted that the ah9 haplotype from Peru is very early post-Columbian, from before 1600 CE, making it another likely evidence of Polynesian introduction of chicken in South America, along with the Chilean sites (which allow for no other explanation). However the Peruvian haplotype is more related to Micronesia than to Hawaii or Rapa Nui.

Other 17th century samples from Bolivia and Peru (ah5 and ah6) have no obvious connection with either plausible origin. Instead Caribbean sites are probably related to Spain.

A simplified geographical distribution is also offered (oddly enough on a pre-WWI map):

Fig. 2

The authors conclude:

As a result of the careful analysis of archaeologically associated, and in some cases directly dated, ancient DNA samples an early global distribution of haplogroup E chickens has been revealed. This dispersal out of Asia began before 3000 years ago and involved the movement of chickens both westwards to Europe and eastwards into the Pacific. The distribution of haplogroup D likely represents a separate dispersal into the Pacific from a distinct Asian domestication centre. The eventual identification of these centers will greatly enrich our understanding of chicken domestication and the history of dispersals from multiple locations. While unambiguous data does not yet exist to trace any of the detected mtDNA signatures back to specific domestication centers, the analysis of ancient DNA sequences presented here is an important first step towards it. Future research needs to focus on markers identified, from both full mtDNA genomes and nuclear genes which are subsequently targeted in ancient specimens, examined within their historical and/or archaeological context.