This is a truly fascinating film, made by the people of Burkina Faso documenting their own, now vanishing tradition of iron smelting and forging, done again for the sake of historical documentation by the elders who used to do it decades ago (and some youngsters helping too) reproducing all the steps: from charcoal making and iron ore mining and selection, to the construction of the furnaces, the smelting of ore and finally tool-making itself. I cannot recommend it more wholeheartedly:
Showing posts with label Iron Age. Show all posts
Showing posts with label Iron Age. Show all posts
February 17, 2018
October 27, 2016
Mitochondrial DNA from post-Neolithic Santimamiñe (Basque Country)
Four human remains dated to the Bronze Age were sequenced for mitochondrial DNA in Santimamiñe cave (Kortezubi, Biscay, Basque Country), along with single instances from the Neolithic, Chalcolithic and Roman period.
J.C. López Quintana et al., NUEVOS DATOS SOBRE LA SECUENCIA DE USO SEPULCRAL DE LA CUEVA DE SANTIMAMIÑE (KORTEZUBI, BIZKAIA). Arqueología y Prehistoria del Interior Peninsular (ARPI), 2016. Freely accessible (PDF) → LINK [no DOI]
The mtDNA study is not "brand new" but a synthesis of a previous doctoral thesis and advance publications:
Un primer avance de este estudio fue publicado en la monografía de las campañas de 2004 a 2006 de Santimamiñe (Cardoso et al. 2011), incluyendo el conjunto completo en la Tesis Doctoral de L. Palencia Madrid (Palencia 2015).
So we are talking of relatively old data, that has partly remained within the (sometimes absurdly greedy and anti-social) academic circles until now. The relative antiquity of the DNA study is important when assessing it, because genetic analysis is evolving very fast and, in most cases in the rather closed and under-budgeted Spanish universitary circles, they tend to do things "the old way", so we are almost certainly dealing here with HVS-I sequencing, something that is not explicit in the paper (I'm searching for Leire Palencia's thesis to make sure but no luck until now).
If I am correct in this (and I should be), then we must understand that it is impossible in many cases to determine the exact haplogroup in the crucial R0 upper tier haplogroup, which includes HV and the extremely common H. Lacking the original HVS-I sequences by the moment, I can't but take the authors labels at face value but I must warn here that where it reads "R0" it is almost certainly H (HV0 or V are easy to recognize with this method, as is R0a) and where it reads "H1" it is probably H1 but not 100% certain.
For more details see the relevant PhyloTree page, where the HVS-I markers are the last bloc in blue, beginning always with the sequence "16" (the other markers in blue of lower numerical value are HVS-II, more rarely used, and the ones in black are the coding region markers, which are in this case fundamental for proper assignment).
The mtDNA haplogroups (as reported) are:
- Neolithic:
- U5a2a (S2011-M2, c. 5100 BCE)
- Chalcolithic:
- T2b (S-1, c. 2000 BCE)
- Bronze Age:
- U5b (S2011-M1 c. 1700 BCE)
- H1 (S2011-M4, c. 1700 BCE)
- R0 (S2011-M6, c. 1500 BCE)
- U3a (S2011-M3 c. 1300 BCE)
- Roman period:
- R0 (S2011-M5, c. 300 CE)
Interpretation attempts
It's difficult to extract conclusions from them but they should be compared with other sequences from the area, for which I recommend my 2013 synthesis. In general, treat "R0" as meaning "H", even if I chose to use a different color (magenta instead of red) for exactitude.
In order to aid that analysis, I reproduce here my 2013 graphic:

We cannot compare the single Neolithic and Roman Era individuals but we can compare the Satimamiñe Chalcolithic+Bronze group of five sequences with the peripheral Chalcolithic large dataset of De La Rúa:
- R*+H (very similar):
- Peripheral "Basque" Chalcolithic: ~40%
- Santimamiñe Chalcolithic+Bronze: 40%
- Santimamiñe Bronze only: 50%
- U(xK) (very different):
- Peripheral "Basque" Chalcolithic: ~15%
- Santimamiñe Chalcolithic+Bronze: 40%
- Santimamiñe Bronze only: 50%
- Other lineages (all them of certain Neolithic immigrant origin, very different too):
- Peripheral "Basque" Chalcolithic: ~45%
- Santimamiñe Chalcolithic+Bronze: 20%
- Santimamiñe Bronze only: 0%
However one of the U(xK) lineages in Santimamiñe is U3, which is also quite certain to be of Neolithic immigrant origin, and one is an important figure when n=5 so we can also see it this way:
- Paleolithic lineages:
- Peripheral "Basque" Chalcolithic: ~55%
- Santimamiñe Chalcolithic+Bronze: 60%
- Santimamiñe Bronze only: 75%
- Neolithic lineages:
- Peripheral "Basque" Chalcolithic: ~45%
- Santimamiñe Chalcolithic+Bronze: 40%
- Santimamiñe Bronze only: 25%
The comparison of #1 with #2 is much more similar. This could be important, because Santimamiñe is not anymore a "peripheral" site, as are those from De La Rúa's dataset, but a rather central one with a extremely long and uninterrupted Paleolithic sequence, dating to Neanderthal-made Chatelperronian culture. It is still a single site with a small number of samples but it does provide a counterpoint that, in one approach could produce similar results.
But, surprisingly, when we consider a distinct Bronze Age category, comparing not anymore with #2 but with #3 everything changes, suggesting a totally different interpretation of the available dataset, in which, the "Chalcolithic interlude" (if real at all, more data is needed) would be reversed quickly with the onset of the Bronze Age.
I am sorry but I cannot lean for either interpretation: the data is just not extensive enough to allow for conclusions. I am tempted to support the continuity hypothesis, allowing only for lesser changes to happen, and keep the Chalcolithic dataset under a big question mark, but the question mark is admittedly a bit smaller now: something in terms demographic may have happened in the Chalcolithic period and may have been reversed in the Bronze Age. But "may" is not "for sure", we need more data points.
Feel free to discuss in good mood, as always.
Thanks for the heads up to Jean Lohizun (again).
January 23, 2016
Ancient DNA from England suggests strong impact of Germanic invasions
Recently sequenced Roman, Iron Age and Anglo-Saxon DNA sequences from England help to clarify the issue of the impact of Germanic migrations in Great Britain, which seems to have been significant.
Rui Martiniano et al., Genomic signals of migration and continuity in Britain before the Anglo-Saxons. Nature 2016. Open access → LINK [doi:10.1038/ncomms10326]
Abstract
The purported migrations that have formed the peoples of Britain have been the focus of generations of scholarly controversy. However, this has not benefited from direct analyses of ancient genomes. Here we report nine ancient genomes (~1 ×) of individuals from northern Britain: seven from a Roman era York cemetery, bookended by earlier Iron-Age and later Anglo-Saxon burials. Six of the Roman genomes show affinity with modern British Celtic populations, particularly Welsh, but significantly diverge from populations from Yorkshire and other eastern English samples. They also show similarity with the earlier Iron-Age genome, suggesting population continuity, but differ from the later Anglo-Saxon genome. This pattern concords with profound impact of migrations in the Anglo-Saxon period. Strikingly, one Roman skeleton shows a clear signal of exogenous origin, with affinities pointing towards the Middle East, confirming the cosmopolitan character of the Empire, even at its northernmost fringes.
Notice that I say Germanic rather than Anglo-Saxon because I'm not sure how much can be attributed to these and how much to Vikings, whose genomes were similar. A recent study on British genetics seemed to indicate that the Danish (Viking) origins were clearly more important than the Saxon ones from Low Germany. However... were the original Angles more akin to Saxons or to Danes?
Anyway, the ancient samples are mostly Romano-Briton, from burials at Driffield Terrace, near York (Eboracum), dating to c. 200 BCE and including many decapitated remains. Another sample is from the Iron Age of Melton (East Yorkshire), dated between 200 and 40 CE. Finally a Christian Anglo-Saxon individual from Norton (Teesside, 70 Km north of York), dated sometime between the 7th to 10th centuries.
Excepted one Roman era outlier (3DRIF-26), who seems an immigrant from the Eastern Mediterranean (autosomal DNA strongly suggests the Levant or Arabia), the rest all fit well with the autosomal genetics of the Iron Age one and modern Welsh. Modern English seem to have, in most cases, at least some Germanic admixture:
 |
|
(a) PCA of the Roman samples from
Driffield Terrace (excluding one outlier), one Iron-Age individual and
one Anglo-Saxon merged with modern Irish, British and Dutch genotype
data. (b) Boxplot of PC1 broken down by subregion. The symbols on
the left represent the significance of a Mann–Whitney test performed to
compare the Roman population with all other populations in the data
set. There were no significant differences between the Roman sample and
the present-day Welsh, Northern and North Western English samples
included in this analysis; all other regions had significantly different
median values for PC1. Population key: Du, Dutch; En, English; Ir,
Irish; NS, not significant; Sc, Scottish; Wa, Wales. NS-P>0.05; *0.05>P>0.01; **0.01>P>0.0001; ***P<0.0001.
|
Using the Dutch average as proxy for continental Germanics and the Welsh average for Romano-Britons, it would seem that modern English are on average, about 1/3 drifted towards Germanics, while the ancient Anglosaxon from Teesside was a bit more than half drifted in that direction. He was still within modern English variance, although rather towards the Germanic extreme of it.
Haploid lineages
The Iron Age sample was a woman with mtDNA haplogroup U2e1e.
The Romano-Brithons (all men), excluding the Eastern Mediterranean outlier, carried all variants of Y-DNA haplogroup R1b1a2a1-M412. It is notable that M405/U106 ("North Sea" subclade) was found in two of them, so it cannot be attributed to Germanic immigration. Another carried a sublineage of the M529 ("Irish") subclade (common also in Great Britain) and two others of the S28/U152 ("Alpine") sublineage (less common in Britain). The remaining two carried upstream L52* (generic "West European") paragroup lineages. See this entry for overall distribution details.
Their matrilineages were all subclades of H1, H2, H6 and J1. Details can be found in table 1.
The outlier carried Y-DNA J2-L228 and mtDNA H5. The patrilineage fits well with a West Asian origin (an Italian one also fits) but the matrilineage is much more common in SE Europe, although it also reaches high frequencies in Wales. However the ADMIXTURE analysis strongly negates the possibility that he was European and very clearly supports a West Asian origin instead.
Finally the Anglo-Saxon man carried Y-DNA lineage I1 (most common in Sweden but scattered at low frequencies through Europe) and mtDNA H1.
Other details
The authors estimate that Iron Age and Romano-British samples were typically brunette with brown eyes. There is one exception though, 6DRIF-18, who was probably blond and blue-eyed, as was surely the Anglo-Saxon.
Blood type O was inferred for all Iron Age and Roman era samples, except 6DRIF-22 who was A. The Anglo-Saxon one may have carried type B or A (or AB?)
May 11, 2014
Ancient Thracians, Ötzi and the origins of modern Europeans (another point of view)
A recent study has sequenced the DNA of an ancient Thracian woman but, for some reason, instead of looking at her comparison with modern Bulgarians and such, they have written a study that mostly goes about Ötzi "the iceman" and has not a single Bulgarian sample.
Martin Sikora et al., Population Genomic Analysis of Ancient and Modern Genomes Yields New Insights into the Genetic Ancestry of the Tyrolean Iceman and the Genetic Structure of Europe. PLoS Genetics 2014. Open access → LINK [doi:10.1371/journal.pgen.1004353]
Abstract
Genome sequencing of the 5,300-year-old mummy of the Tyrolean Iceman, found in 1991 on a glacier near the border of Italy and Austria, has yielded new insights into his origin and relationship to modern European populations. A key finding of that study was an apparent recent common ancestry with individuals from Sardinia, based largely on the Y chromosome haplogroup and common autosomal SNP variation. Here, we compiled and analyzed genomic datasets from both modern and ancient Europeans, including genome sequence data from over 400 Sardinians and two ancient Thracians from Bulgaria, to investigate this result in greater detail and determine its implications for the genetic structure of Neolithic Europe. Using whole-genome sequencing data, we confirm that the Iceman is, indeed, most closely related to Sardinians. Furthermore, we show that this relationship extends to other individuals from cultural contexts associated with the spread of agriculture during the Neolithic transition, in contrast to individuals from a hunter-gatherer context. We hypothesize that this genetic affinity of ancient samples from different parts of Europe with Sardinians represents a common genetic component that was geographically widespread across Europe during the Neolithic, likely related to migrations and population expansions associated with the spread of agriculture.
Notice please that, as the authors acknowledge, the DNA of the second Thracian individual, K8 may be contaminated:
the DNA damage pattern of this individual does not appear to be typical of ancient samples (Table S4 in [15]), indicating a potentially higher level of modern DNA contamination.
This does not seem to dissuade them to use it in the analyses.
Notice that, instead of attempting to model moderns on ancients, as would seem logical from the viewpoint of purported ancestry but would be incomplete for lack of a sufficiently large ancient sample or allow the ancient samples to "float freely" in the analysis, the researchers decided to force them into modern parameters what is still valid, because it indicates greater or lesser affinity to the various studied modern populations (among which there's not a single Balcanic sample, oddly enough).
We can see that:
- Epipaleolithic Iberian Braña 1 approximates the French structure but is somewhat "more Basque" than these.
- Neolithic Pitted Ware semi-forager Ajv70 (Gotland) approximates the Orcadians very well.
- Neolithic Megalithic/Funnelbeaker Gok4 (Southern Sweden) approximates North Italians.
- Chalcolithic North Italian Ötzi (Iceman) is close to Sardinians but not quite the same ("more Basque" again).
- Iron Age Thracian commoner P 192-1 approximates Tuscans.
- I would ignore princely Thracian K8 because of the aforementioned contamination issues.
For completeness, I'm including here also fig. S1, which includes runs 1-8 of ADMIXTURE:
 |
| Fig S1- ADMIXTURE results for HGDP. Panels show the results for ADMIXTURE runs for k = 2 to k = 8 ancestral clusters on the HGDP individuals, and the corresponding cluster proportions inferred for the ancient samples. |
Notice (see fig. S7) that K=3-5 are quite poor fits and
therefore both should be ignored as meaningless. From K=6 onwards the
scores slightly improve for all the ancient samples, however it must be
said that K=2 is in general the best fit form most European populations,
being most of the improvement in error score due to better
approximation to West Asian samples.
In most cases Basques have the lowest or one of the lowest fitness scores (except at K=5, where Basques are portrayed as a Russian-Sardinian mix, what is clearly a confounding artifact). Sardinians also have very low error scores but only from K=5 onwards, when the Sardinian component becomes apparent. The Iceman has very low error scores for all K values, while the Thracian samples have the greater ones, maybe owing to the lack of Balcanic samples.
For me these error results suggest that ancients are fine being just "unspecific Europeans" (K=2 blue), while the low error score for Basques and Sardinians surely underline that these are about the only modern populations which can be explained as simple Paleolithic-Neolithic mix, without need of a third Indoeuropean extra ancestry.
They also projected the ancient samples onto PCA plots of modern European populations:
 |
| Fig S2 - PCA results for HGDP. Panels show the results for PCA on the HGDP individuals for subsets of SNPs with data in the respective ancient sample. Each point represents an individual, with plot symbol and color indicating population of origin. The position of the ancient samples was inferred by projecting onto the PC space calculated using the modern samples only. |
For some odd reason the PCAs are different in each case, even if the samples are the same (only moderns used, ancients are "projected" and should not affect the result). I have no explanation for this issue and I reckon I'm tempted to write to the authors asking for this unexpected complexity, which seems product of the projection itself altering the graph.
Whatever the case, the projection of the ancient samples, follows in general terms the patterns noted above for the ADMIXTURE graph:
- La Braña 1 projects between French and Basques.
- Ajv70 projects onto Orcadians, tending also towards France.
- Ötzi projects between Sardinians and Italians.
- Gok 4 with North Italians but not far from Basques.
- P 192-1 doesn't seem too akin to any specific modern population, although some French, Basques and Tuscans do approximate her.
These results may be frustrating for those already too accustomed to the previous analysis of ancient autosomal DNA but we must not forget that, because of its huge size and complexity, autosomal DNA requires statistical analysis, which is highly susceptible to variations in sample strategy particularly, as well as to other not always well understood factors. Hence different points of view are generally complementary rather that outright contradictory.
Of some interest is also this TreeMix graph of modern populations and Ötzi:
It is notable the African low level admixture arrow at the root of the Euro-Mediterranean branch (the so-called "Basal Eurasian" element in Lazaridis 2013) and the East Asian component in Finns. Also sizable admixture from the West Eurasian root is apparent among Tuscans. Once these admixture axes are allowed for, the topology of the European tree changes significantly, showing a main split between Eastern Europeans (Finns) and Western/Southern ones.
Other similar trees are available in fig. S6.
No extra Neanderthal admixture in Ötzi
Contrary to some previous rough estimates, Ötzi does not appear to differ from other Europeans in Neanderthal ancestry at all. See figs. S9 and S10.
May 4, 2014
Amesbury has Epipaleolithic roots
 |
| Old map of Avesbury and the nearby hillfort |
Recent field work at the town of Amesbury, specifically in Blink Meadow, has resulted in it being proclaimed in the media as "the oldest town in Britain". What it really means is that the site was occupied and had ritual significance before the Neolithic, since c. 8820 BP.
A possible reason for the magnetism of this location is that a nearby spring has the "magical" effect of turning some types of flint to a bright pink or fuchsia color. This is caused by certain algae but it must have appeared miraculous to ancient peoples.
The district now proclaimed oldest continuously inhabited town in Britain has a large complex of ritual sites dating to the Chalcolithic period ("Neolithic" in British archaeo-slang).
It also includes a large Iron Age hillfort of unusual shape, inadequately named as "Vespasian's Camp". This fort which continued in use in the Roman period is suspected by many to be the real Camelot.
 |
| Pink colored flint pieces from Amesbury |
Sources and more details: The Archaeology News Network, Express.
February 28, 2014
SW African Bantu matrilineages
Prolific researcher Chiara Barbieri has put online another interesting study on African genetics, this time about the Bantu populations of Southwestern and Central-Southern Africa (i.e. Namibia, Angola, Botswana and Zambia).
Chiara Barbieri et al., Migration and interaction in a contact zone: mtDNA variation among Bantu-speakers in southern Africa. bioRXiv 2014. Freely accessible (pre-pub) → LINK
ABSTRACT
Bantu speech communities expanded over large parts of sub-Saharan Africa within the last 4000-5000 years, reaching different parts of southern Africa 1200-2000 years ago. The Bantu languages subdivide in several major branches, with languages belonging to the Eastern and Western Bantu branches spreading over large parts of Central, Eastern, and Southern Africa. There is still debate whether this linguistic divide is correlated with a genetic distinction between Eastern and Western Bantu speakers. During their expansion, Bantu speakers would have come into contact with diverse local populations, such as the Khoisan hunter-gatherers and pastoralists of southern Africa, with whom they may have intermarried. In this study, we analyze complete mtDNA genome sequences from over 900 Bantu-speaking individuals from Angola, Zambia, Namibia and Botswana to investigate the demographic processes at play during the last stages of the Bantu expansion. Our results show that most of these Bantu-speaking populations are genetically very homogenous, with no genetic division between speakers of Eastern and Western Bantu languages. Most of the mtDNA diversity in our dataset is due to different degrees of admixture with autochthonous populations. Only the pastoralist Himba and Herero stand out due to high frequencies of particular L3f and L3d lineages; the latter are also found in the neighboring Damara, who speak a Khoisan language and were foragers and small-stock herders. In contrast, the close cultural and linguistic relatives of the Herero and Himba, the Kuvale, are genetically similar to other Bantu-speakers. Nevertheless, as demonstrated by resampling tests, the genetic divergence of Herero, Himba, and Kuvale is compatible with a common shared ancestry with high levels of drift and differential female admixture with local pre-Bantu populations.
 |
Figure 1: Map showing the rough geographical location of populations,
colored by linguistic affiliation. Abbreviations of population labels are
as specified in Table 1.
|
In spite of the Bantu-centric approach of the study, which also has its merits, my greatest interest is rather in the less typically Bantu lineages, which speak of admixture with several pre-Bantu populations.
In this sense I find the following highlights:
 |
| Fig. S2 (annotated in green by Maju): CA plots based on haplogroup frequencies. Left: all the dataset, right: excluding outliers. |
L3d and L3f founder effect:
The Himba and Herero, as well as the non-Bantu pastoralists Damara make one distinctive cluster defined by the high frequencies of haplogroup L3d, as well as L3f (not present among the Damara but found among the Kuvale). As discussed in the paper, the Himba and Herero may be related to the Kuvale of SW Angola but they have notable differential levels (or directionality) of aboriginal admixture.
As both L3d and L3f are present in West and East Africa alike, it is interesting to track the specific subhaplogroups implicated in this founder effect, something done in fig. 4.
The main L3d sublineage is L3d3a1, whose haplotype network shows a largely Khoisan centrality (not Damara) although this node is shared also by some unspecified "other Bantu". The Southern Africa specificity of L3d3a was already noticed in the past (see here). So it is very possible that we are before an aboriginal Southern African lineage, maybe arrived with the first Khoisan Neolithic (or whatever other ancient flow) rather than a Bantu-specific founder effect.
The main L3f subhaplogroup is L3f1b4a, which seems more specifically Bantu, with a major branch concentrated among the Himba, Herero and Kuvale. This lineage is not found among the Damara in spite of the other strong affinity of this Khoisan population towards the Himba and Herero. L3f1b is found in Southern Africa, Kenya and Oman (per Bihar 2008), so we are probably before a distinctive East African element, not too likely to be genuinely Bantu but possibly just assimilated into Bantu ethnic identity.
Even if both lineages converge in the Himba and Herero, they are almost certainly different inputs, one of Damara (herder Khoisan) origin and the other of Bantuized East African origin maybe.
L1b founder effect:
L1b is essentially a West African lineage concentrated in the Sahel area from Chad westwards (although L1b1a2 is from the Nile basin). A particularly high frequency population are the Fulani pastoralists, original from the Westernmost African plateaus, who ruled many kingdoms in West Africa between the collapse of the colonial rule by Morocco and the consolidation of the European conquest of the continent.
As this study does not dwell in sublineages, we cannot understand the most likely specific origins of it among several Southern African populations, specifically the pooled NE Zambians (13%) and the Fwe and Shanjo of SW Zambia (24-27%).
In any case it is a notorious founder effect, almost absent in other Bantus of the area (0-10%).
Typical L0d Khoisan admixture:
This element is concentrated in Botswana (~25%) and with highest frequencies in the SW Kgalagadi (53%). It is also important among the Kuvale of SW Angola (21%). Other Bantu populations in this dataset have frequencies under 10%, some even zero. The Damara have 13%.
We know from previous studies that it is also found at high frequencies among the Xosha of South Africa (L0d3).
While L3h appears marked in the graph, the lineage is in fact absent in all populations except at very low frequency among the Kuvale (2%), so it does not seem actually of any relevance.
Less typical L0k around SW Zambia:
While L0k is generally considered an aboriginal Southern African lineage it has a much more northernly distribution than the more common and surely older L0d. Its area of greatest commonality seems to be SW Zambia (see here and here).
This study confirms this distribution:
 |
Supplementary Figure S3[A]: Haplogroup frequencies of important haplogroups in the populations studied here. A: Haplogroups L0d and L0k.(...)
The size of the circles is proportional to the sample size. |
High frequencies of L1c (Pygmy admixture marker) among Southern African Bantus:
An interesting element is the commonality of L1c, typical of Western Pygmies and some other populations from Gabon (possibly representative of the wider West-Central Africa jungle region, not too well studied otherwise), among almost all Bantu populations in this dataset.
The exceptions are the Herero, Himba, Kgalagadi and Tswana (0%), as well as the NE Zambians (4%). All the rest have frequencies between 12% and 30%. Even the non-Bantu Damaras have 11% of it.
In my understanding this almost certainly implies a notable level of admixture with Western Pygmies of the Bantus from especially Angola and West Zambia. A phenomenon that may be widespread in Central-West Africa.
It is notable however that at least many of the populations with the highest likely Khoisan admixture (in its various forms, discussed in the previous sections) have the lesser frequencies of L1c (Pygmy admixture). So to a great extent these two aboriginal influences in Bantu mtDNA seem mutually exclusive and were probably produced after settlement rather than "on the march".
This in turn arises some interesting questions about the ethnic geography of Africa before the Bantu expansion.
Update: I just noticed that Ethiohelix has parsed the haplogroups' frequency into a very helpful chart → LINK.
Update: I just noticed that Ethiohelix has parsed the haplogroups' frequency into a very helpful chart → LINK.
See also:
- My latest reconstruction of human early expansion in Africa (within a larger entry) → LINK
December 15, 2013
Ancient East Asian Y-DNA maps
I'm fusing here data from two different and complementary sources:
- Hui Li et al. Y chromosomes of prehistoric people along the Yangtze River. Human Genetics 2007. → LINK (PDF) [doi:10.1007/s00439-007-0407-2]
- A 2012 study integrally in Chinese (so integrally that I don't even know who the authors are → LINK) but whose content was discussed in English (after synthetic translation) at Eurogenes blog. I deals with a variety of ancient Y-DNA from the Northern parts of P.R. China.
Update (Dec 25): much of the Northeastern aDNA is also discussed in an English language study (h/t Kristiina):
Yinqiu Cui et al. Y Chromosome analysis of prehistoric human populations in the West Liao River Valley, Northeast China. BMC 2013. Open access → LINK [doi:10.1186/1471-2148-13-216]
Combining the data from both sources, I produced the following maps:
Neolithic (before ~4000 BP):

Metal Ages (after ~4000 BP):

Discussion
I find particularly interesting the first map because it outlines what seem to be three distinct ethnic (or at the very least genetic) regions in the Neolithic period:
- A Central-South region dominated by O3
- An Eastern area around modern Shanghai dominated by O1
- A Northern region dominated by N
Later on, in the Metal Ages, a colonization of the North/NE by these O3 peoples seems apparent, followed, probably at a later time, by a colonization of the West (Taojiazhai).
We do not have so ancient data for the West but we can still see a diversity of lineages, notably Q (largely Q1, if not all), C (most likely C3, also in the NE) and N (also in the NE). While the arrival of O3 to this area was probably late, the arrival of R1a1a is quite old, however it is still almost certainly related to the first Indoeuropean migrations eastwards, which founded the Afanasevo culture in the area of Altai.
I find also very interesting the presence, with local dominance often, of N (including an instance of N1c) and Q in the Northern parts of P.R. China, because these lineages are now rather uncommon but are still dominant in Northern Asia, Northeastern Europe and Native America. The fact that they were still so important in the Northern Chinese frontier in the Neolithic and even in the Metal Ages should tell us something about their respective histories and, in the case of N, origins as well.
It is also notable that no D was detected anywhere. However the regions with greatest D frequencies like Tibet, Yunnan or Japan were not studied.
See also: Ancient Jomon mtDNA from Japan.
September 12, 2013
Are ancient mtDNA sequences from Syria of Indian origin?
Honestly, I have all kind of doubts but that's what a new study claims on the basis of just a few hypervariable sequence markers:
Henry W. Witas, mtDNA from the Early Bronze Age to the Roman Period Suggests a Genetic Link between the Indian Subcontinent and Mesopotamian Cradle of Civilization. PLoS ONE 2013. Open access → LINK [doi:doi:10.1371/journal.pone.0073682]
The authors sequenced the HVS-I (and nothing else!) of the mtDNA of four individuals from Tell Ashara and Tell Ashaik sites of ancient Terqa and Kar-Assurnasirpal (Syria, Euphrates river). And then they proceded to establish a bit unlikely comparisons with East and South Asian M sublineages, of which only one is present today in the region.
The sequences are (supp table 3, all numbers +16,000 and counting from the CRS, i.e. H2a1 underived, GenBank: NC_012920):
- TQ28F112: 223-234
- MK13G117: 223-234-311
- TQ28F256: 223-234-270
- MK11G107: 223-266-289
The first two are attributed to M9, the third one to M61 (a quite rare haplogroup) and the last one to M4b (the only one to be found in West Asia nowadays, specifically in Arabia Peninsula).
Now what do the markers actually say? All are highly variable sites and independently can be found in many lineages, however most typically:
- 223 describes R, hence counting from the CRS, it should mean L(xR).
- 311 describes L3, hence counting from the CRS it should mean L(xL3).
So all four should be L(xR) and MK13G117 looks like L(xL3).
Exceptions for 311 (consistent with the sequence above): L3b1a3, M4'65'67, M10, M29'Q, M31a1, M56, M57 and M74. However M9 does not make it because to begin with it needs a transition at the 362 site.
The authors got carried away by their own pre-conceptions and the marker 234, shared by three of the four sequences. However, while that marker is found in M9a, it also needs the 362 marker, which they both lack. So they are not M9 but something else.
More plausible candidates could be, at least for TQ28F112, M30d/e or M49.
As for the rest, there are no modern sequences, at least via PhyloTree (but neither within the study's own comparisons), that are good correlates. All we can say with certainty is that they are L3(xR), except in the case of MK13G117, which can only be described as L(xR).
Maybe if they had tried sequencing the coding region, as in my understanding, they MUST (destroying or damaging valuable ancient bones to do this mediocre research is not anymore justified, if it ever was), they would have got useful and informative results. Now we just have again another frustrating set of nearly useless HVS-I sequences, which can only be ambiguous in the vast majority of cases.
Ah, by the way, there's no obvious correlation between these Metal Ages' sites and ancient Sumerians, of course. Even if the lineages are South Asian by origin or affinity, which is possible but by no means demonstrated, they would at most suggest a relation between the Mid-Upper Euphrates and that area. The region was under intermittent Sumerian, Amorite, Babylonian, Kassite and Assyrian control but mostly is a distinct country within the greater Mesopotamian area.
Notice that previous research (ref.) in the same area but from the Neolithic (PPNB) period has found (also HVS-I) large amounts of mtDNA K, some H and also some L3(xR).
[Note: edited because some ethnographic assumptions I made initially seem to be quite wrong].
Update (2015): the chronology actually corresponds with the Mitanni period. This suggests that whatever true Indian mtDNA was brought by Indo-Aryans coming directly from Pakistan or nearby areas (rather than from the steppe).
May 22, 2013
Ancient West Siberian mtDNA
Kristiina called my attention recently to this open access article on the ancient mtDNA of a district of South-Western Siberia known as Baraba.
V.I. Molodin et al., Human migrations in the southern region of the West Siberian Plain during the Bronze Age: Archaeological, palaeogenetic and anthropological data. Part of a wider book published by De Gruyter (2013). Open access → LINK
 |
| Fig. 1 - click to expand |
Quite interestingly we see in the data that before 3000 BCE this part of Western Siberia (see locator map at the right) shows already signs of West-East admixture, much earlier than Central Asia did.
This fact is consistent with the apparently old admixture detected among the Khanty in autosomal DNA and also with the Epipaleolithic presence of East Asian mtDNA (C1) in NE Europe and the putative Siberian origins of the Uralic family of languages and Y-DNA haplogroup N in NE Europe.
 |
| Fig. 2 (left) | Chronological time scale of Bronze Age Cultures from the Baraba region Fig. 3 (main) | Phylogenetic tree of 92 mtDNA samples obtained from the seven Bronze Age cultural groups from the Baraba region. Color coding of the groups as in Figure 2 |
The Ust-Tartas culture is part of the wider Combed Pottery culture, usually thought to be at the origins of Uralic peoples in NE Europe and Western Siberia, and shows an almost balanced apportion of Eastern lineages (C, Z, A, D) and Western ones (U5a, U4, U2e), suggesting that the process of admixture was by then already consolidated.
However the Odinovo cultural phase shows a change in this trend, with a clear hegemony of Eastern lineages (notably D) and almost vanishing of Western ones. Trend that continues in its broadest terms in the Early Krotovo phase.
Odinovo is part of the wider phenomenon known as Seima-Turbino, initiator of the Bronze Age in wide parts of Northern Asia and believed to be original of Altai. However the lineages do not correspond at all with the Altaian Bronze Age genetic pool, fully Western in affinity, excepted those from Mongolian Altai, which are all D. Hence the apparent demic replacement happening in this period must have been from the Mongolian part of Altai or some other region and not the core Altai area.
The oriental affinity of Early Krotovo is instead caused by a more diverse array of lineages (less D more CZ and A), which is interpreted materially as reflecting migrations from Northern Kazakhstan (Petrovo culture). However, as mentioned before the known mtDNA pool of Central Asia in that period is completely of Western Affinity, so we must in principle discard Kazakhstan as the origin of the probable demic flows.
Let me here mention that the authors insist on continuity through these three phases, however I see a very different picture in the same data, with Western lineages almost vanishing with Odinovo and Eastern ones clearly changing in frequency well beyond reasonable expectations on random fluctuations.
It is only in Late Krotovo when Western lineages reappear in significant numbers, probably reflecting, now yes, migrational flows from the South. This trend is clearly reinforced in the Andronovo, Baraba Late Bronze and transition to Iron Age phases, suggesting growing influence from Andronovo culture (early Indo-Iranians).
May 9, 2013
Echoes from the past (May-9-2013)
I am getting updated with a rather long backlog, so I will speed things up placing here in nearly telegraphic style the informative snippets that require less work. This does not mean that they are less interesting, not at all, just that I have to adapt to that elusive quality of time...
Middle Paleolithic
Toba supervolcano only had short-term climate effect → BBC.
Research on Lake Malawi's sediments shows that the climate-change effect of the catastrophic eruption was limited. Droughts previously believed to be from that period have been revised to be from at least 10,000 years before, corresponding to the end of the Abbassia Pluvial rather than to Toba super-eruption.
Upper Paleolithic
Altai rock art and early astronomy from 16,000 BP → Siberian Times, Daily Mail.
Sunduki (Khakassia), here there are what are surely the oldest rock art of Northern Asia, representing people hunting or interacting among them, which are from just centuries ago, however other petroglyphs are apparently much older like this horse:
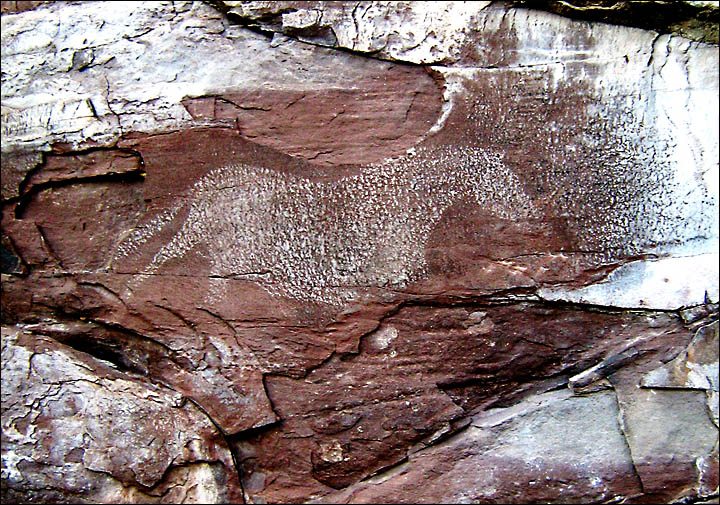
Prof. Vitaly Larichev (Institute of Archeology and Ethnography, Russian Academy of Sciences) has detected a whole astronomical structure implemented in the landscape.
He claims to have found 'numerous ancient solar and lunar observatories around Sunduki'.
'This square pattern of stones on the ground shows you the place', he told visiting author Kira Van Deusen. 'I knew there would be an orientation point, but we had to search through the grass for a long time to find it.
'Now look up to the top of that ridge. You see a place where there is a crack between the rocks? If you were here on the summer solstice, you would see the sun rise right there. Or you would if you were here 2,000 years so. Now the timing is slightly differen'.
High on one cliff wall is a rock engraving showing dragon heads in one direction, and snake heads in the other.
'If the sun were shining, we could tell the time,' he said. 'In the morning the shadow moves along the snake's body from his head to his tail, and in the afternoon it comes from the other direction along the dragon.
'From the same observation point you can determine true north and south by sighting along the mountains'.
Neolithic
Vietnam: early cemetery dug in Thahn Hoa → Australian National University.
Some 140 human remains of all ages have been unearthed at the site of Con Co Ngua, estimated to be 6-4000 years old. Cemeteries of this size and age were previously unknown in the region. The site has also revealed a dearth of artifacts.
The people were buried in fetal position with meat cuts of buffalo or deer.
Chalcolithic
India: 4000 y.o. stone tools unearthed in Bhopal (Madhya Pradesh, Narmada river) → India Today.
Details:
- Some of them are decorated with aquatic animals.
- 150x200 m. mound in Birjakhedi
- Terracotta game pieces
- Pottery (incl. jars, pots, dishes)
- Stone and ivory beads
 Bell Beaker rich lady's burial unearthed in Berkshire (England) → Wessex Archaeology.
The middle-aged woman wore a necklace of tubular golden beads, amber buttons on her clothes and a possible lignite bracelet. She was accompanied by a bell-shaped beaker of the "corded" type (oldest and roughest variant, of likely Central European inception).
The chemical signature of the gold beads is coherent with deposits from Southern Britain and SE Ireland.
Giza pyramid construction's logistics revealed → Live Science.
Caesar beat the Gauls.Was there not even a cook in his army?
Bertolt Brecht (A Worker reads History)
Now we know that at the very least the famed early pharaohs Khafra, Khufu and Menkaure, who ordered the massive pyramids of Giza to be built as their tombs did have some cooks in charge of feeding the many workers who actually built them, stone by stone.
These workers were housed in a village some 400 meters south of the Sphinx, known as Heit el-Ghurab. In this place archaeologists have found a cemetery, a corral with apparent slaughter areas and piles of animal bones. Based on these, researchers estimate that more than 2,000 kilograms of meat were eaten every day during the construction of Menkaure's pyramid, the last and smallest one of the three geometric mounds.
The figures estimated for such a logistic operation border disbelief: 22,000 cows, 55,000 sheep and goats, 1200 km² of grazing land (roughly the size of Los Angeles or 5% of the Nile Delta), some 3500 herders (adding up to almost 20,000 people if we include their families).
A curious detail is that most of the beef was destined to the building of the overseers, while the common workers were mostly fed sheep or goat instead. Another settlement to the East of apparently local farmers ate most of the pork. There were also temporary tent camps closer to the pyramids.
Iron Age
Late Indus Valley Civilization was overcome by violence → National Geographic.
 |
| Harappa (CC by Shephali11011) |
The Late Indus Valley Civilization (Cemetery H cultural layer, usually attributed to the Indoeuropean invasions) was, unlike in previous periods, quite violent, new evidence highlights.
The evidence from the bones also highlights the arrival of many non-local men, who apparently married local women. But the most shocking element is the striking evidence of widespread violence:
The skull of a child between four and six years old was cracked and crushed by blows from a club-like weapon. An adult woman was beaten so badly—with extreme force, according to researchers—that her skull caved in. A middle-aged man had a broken nose as well as damage to his forehead inflicted by a sharp-edged, heavy implement. Of the 18 skulls examined from this time period, nearly half showed serious injuries from violence ...
Gaming pieces of Melton Mowbray (England) → Science Daily.
Excavation of a hillfort at Burrough Hill revealed ancient gaming pieces, among other materials.

 |
| (CC by P.A. Salguero Quiles) |
The tomb has an access gate and is estimated to be from the 5th or 4th centuries BCE (Iberian culture) and, unlike most burials of the time, the corpse was not incinerated.
The finding highlights the need for further archaeological work in all the hill but the severe budgetary cuts threaten this development.
Baza (Granada) hosts a dedicated archaeological museum inaugurated in 2011.
Tocharian mummy buried with marijuana hoard → Paleorama[es].

Some 800 grams of the psychedelic plant, including seeds, were found at the burial place of a Tocharian man, presumably a shaman, at Yanghai (Uyghuristan), belonging to the Gushi culture and dated to at least 2700 years ago. The plant belongs to a cultivated variety.
Some of the oldest cannabis evidence are also from that area (Pazyrk culture c. 2500 years ago) and also from Nepal (Mustang, similar dates). Later in Southern Central Asia it was used in combination with opium and ephedra, from where soon migrated to South Asia and many other parts of Eurasia.
Genetics

New device radically reduces costs and time in DNA extraction → Science Daily.
Researchers from the University of Washington and NanoFacture Inc. have developed a device, which looks like a kitchen appliance, able to extract DNA from tissues (like saliva or blood) in minutes at low cost and without using the toxic chemicals habitual in the field.
The prototype is designed for four samples but can be scaled for the lab standard of 96 samples at once.
March 27, 2013
SE Iberian pollution in the Metal Ages
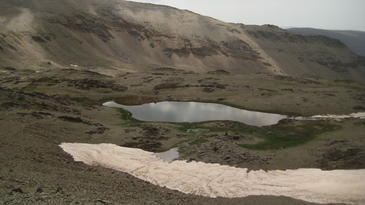
One of the earliest cases of overexploitation and pollution in Europe has been found in SE Iberia, a key center of Early Bronze in Western Europe (Argaric civilization). The sediments of a lake in Sierra Nevada (Andalusia), known as Laguna de Río Seco (pictured), have provided the evidence for important pollution c. 3900 years ago, just when the Bronze Age began in the region. This is attributed mostly not to industry but to increase in fires and deforestation.
However, as we get into the Late Bronze (post-Argaric culture) and Iron age (Iberian culture), the evidence speaks of a type of pollution which can only be attributed to manufacture: lead. This kind of pollution reached a peak c. 2900 years ago (beginnings of Iron Age) and then again in the Roman era (as well as in the Industrial Age).
It is worth mentioning that lead pollution has decreased in the last decades, caused no doubt by the environmental awareness of these times and derived normative, like banning lead from gasoline.
Ref. A. García Alix et al., Anthropogenic impact and lead pollution throughout the Holocene in Southern Iberia. Science of the Total Environment 2013. Pay per view → LINK [doi:10.1016/j.scitotenv.2013.01.081]
February 27, 2013
Iberian script of Iruña-Veleia
A new study of the Iberian script findings withing the (partly disputed but most likely very real) ostraka graffiti at Iruña-Veleia (Basque-Roman city of Antiquity on which I have written extensively in the past) is freely available online.
Antonio Arnaiz-Villena & Diego Rey, Iberian-Tartessian scripts/graffiti in Iruna-Veleia (Basque Country, North Spain): findings in both Iberia and Canary Islands-Africa. International Journal of Modern Anthropology 2012. Freely accessible → LINK
Abstract
760 officially recognized scripts on ceramics from Iruña-Veleia excavated by the archaeology firm Lurmen S.L. (approximately between years 2002-2008)have been analyzed. A number of these ceramics contains scripts which may be assimilated to Iberian/Tartessian writings. This number may be underestimated since more studies need to be done in already available and new found ceramics. This is the second time that Iberian writing is found by us in an unexpected location together with the Iberian-Guanche inscriptions of Lanzarote and Fuerteventura (Canary Islands). On the other hand, naviform scripting, usually associated to Iberian rock or stone engraving may have also been found in Veleia. Strict separation, other than in time and space stratification, between Iberian and (South) Tartessian culture and script is doubted.
Source: Ama Ata[es].
February 23, 2013
Ancient Cantabrian fortified town: conquered and burned by Rome
Paleorama[es] has an interesting article on how the Ancient Cantabrian castro (fortified town) at Monte Ornedo, located in the modern municipality of Valdeolea (Cantabria, near Palencia, Spain) was captured in fierce battle by the Roman legions in a key battle of the Cantabrian Wars, burned and on top of the remains a Roman fort was built instead (Octaviolca?)

The aboriginal castro covered 19 Ha (=190,000 m², ~47,000 acres), being the largest of its kind known in all Ancient Cantabria. Many brooches (fibulae), characteristic of the indigenous horsemen's clothing are concentrated near the main gate, suggesting that a key episode of the battle took place there. Around the castro, the Romans built their characteristic siege fortifications. Caligae sole nails, tent holding pins and weapons have been found all over the place, including a dagger with silver decorations and even a catapult fire projectile.
After the capture the Romans built there their own fort. First a campaign one with earth walls and then another more consolidated one with stone walls. Milestones defining the pastures assigned to the Legio IV Macedonica from those of the nearby town of Iuliobriga further North have also been found.
See also:
February 15, 2013
Guest article by Gail Tonnesen: Comments on “Origins and Evolution of the Etruscans’ mtDNA”
When discussing a recent revision of the ancient Etruscan mtDNA sequences, it became evident that haplogroup assignation was not really being dealt with by the authors, so Gail Tonnesen has dug on the matter further:
Comments on “Origins and Evolution of the Etruscans’ mtDNA”
In an analysis of Etruscan mtDNA Ghirotto et al. (2013) evaluated haplotype diversity in 30 samples of ancient remains from Etruscan burials that date to between 700-200 BCE. However, the authors did not identify haplogroups for these ancient remains. Analysis of the mtDNA data by haplogroup could provide additional insight into relationships among the ancients samples and to modern populations in the region, so we attempted to identify haplogroups for the 30 ancient mtDNA haplotypes listed in Table S1 of Ghirotto et al. These include 14 samples tested by Ghirotto et al. (2013), and 16 samples tested by Vernesi et al. (2004).

Ghirotto et al (2013) reported results in the mtDNA the control region at markers 16024-16384. Results were reported relative to the revised Cambridge Reference Sequence. These results should be sufficient to identify those haplogroups that have defining mutations in this region. We compared the ancient mtDNA haplotypes to Phylotree version 15. Seven of the haplotypes appear to be U5, however, the U5 defining mutation 16270 was identified in only two of these seven samples. Key defining mutations for U5 subclades that should be present were not identified in several of these samples. For example, samples Hap4 and Hap5 both appear to be U5a2a (based on the combination of 16114a and 16294). U5a2a should also have mutations at 16256, 16270 and 16526, but the test results did not report any of these 3 mutations in Hap4, and only found 16256 was reported in sample Hap5. Reversions at marker 16270 occur infrequently in U5, and it is possible that some of the ancient mtDNA samples could have a reversion at 16270, however, the probability is extremely low that that 5 of 7 samples would have this relatively rare reversion. Thus, based on these probable U5 samples, the reported results for the ancient mtDNA samples appear to have a high error rate of missed markers in their results.
Eight of the samples appear to be JT, based on the mutation at 16126. Two of the samples might be H1b based on the mutation at 16356. We were unable to identify haplogroups for any of the remaining 13 samples. Six of the samples are CRS, but given an apparent high rate of missed identification of 16270 in most of the apparent U5 samples, it is not possible to predict haplogroup for the CRS samples.
Figure 3, the median joining network, has the haplotypes connected in a way that is inconsistent with their probable relationship in the mtDNA phylogeographic tree. We recommend re-evaluating the median joining network using the probable phylogenetic relationships among the samples. We also recommend that the coding region be sequenced for these samples to better determine their haplogroups and subclades, especially for the 13 of the 30 samples whose haplogroup cannot be determined from the control region results. We also recommend sequencing control region more completely because important defining markers for several of the haplogroups tentatively identified here are found in the region from to nucleotide markers 16385 to 16569.
Based on the 17 samples for which we were able to predict haplogroups, JT and U5 are the most common haplogroups in the ancient Etruscans samples. These do not appear to be related individuals because there is considerable diversity in haplotypes among the JT and U5 samples. However, these results are uncertain because of the possibility that the some markers were not reliably detected in the ancient mtDNA samples. Additional testing of the coding region and re-testing of the control region are necessary to fully evaluate the ancient Etruscan samples in the context of ancient and modern populations.
References:
Ghirotto S, Tassi F, Fumagalli E, Colonna V, Sandionigi A, et al. (2013) Origins and Evolution of the Etruscans’ mtDNA. PLoS ONE 8(2): e55519.doi:10.1371/journal.pone.0055519
Vernesi C, Caramelli D, Dupanloup I, Bertorelle G, Lari M, et al. (2004) The Etruscans: a population-genetic study. Am J Hum Genet 74: 694-704.
Subscribe to:
Posts (Atom)