August 31, 2012

East Asians now claimed to be "more Neanderthal" than Europeans

Unlike what John Hawks had apparently found a few months ago but similar to what I thought apparent from the original Green et al. data back in 2010. 

Mathias Meyer et al., A High-Coverage Genome Sequence from an Archaic Denisovan Individual. Science 2012. Pay per view ··> LINK [doi: 10.1126/science.1224344]

Denisovan ancestry is claimed now to be only found among Aboriginal Australasians (Papuans) but then again the data in the supplementary material (freely accessible) seems, to my untrained eyes, to allow for a thin Denisovan genetic influence in all Eurasia. 

I withhold my judgment because there seems to be a lot of sensibility to methodology in this hair-splitting excercise. John Hawks however has written a lengthy article trying to explain why both results appear contradictory regarding which levels of Neanderthal admixture. I would not bet much for his explanation however: I'd rather suspect that the methodology is not sound enough to estimate very thin admixture, so they are getting contradictory results in the uncertainty zone, what is just logical - even if a Schrödingerian kind of logic, of course.

Another finding is that Denisovans were apparently quite endogamous had very low diversity for modern standards, specially in the short bloc zone (ancient bottleneck) but also in the long bloc one (recent endogamy)*.


___________________________________
*Red text was updated, slashed out text was removed after first publication.

August 30, 2012

Comment moderation enabled

Sorry but some very specific individuals are insisting in being annoying and violating the few rules of respect and common sense in spite of repeated warnings.

Hence I have enabled comment moderation for some time as dissuasive tool.

My apologies to all readers and commenters of good will, who I know are the vast majority.

Scotland: Maeshowe Chambered Cairn in 3D animation

Orknejar reports on a 3D video-animation of this important megalithic monument, considered a major piece of which was probably a major religious complex in the Chalcolithic (Late Neolithic), located at Orkney:


See also (older news and reports):

August 29, 2012

Autism does not have genetic causes

Not a single SNP was found to influence the development of autism spectrum disorders in an ample GWAS study:

Richard Anney et al., Individual common variants exert weak effects on the risk for autism spectrum disorderspi. Human Molecular Genetics 2012. Open access ··> LINK [doi: 10.1093/hmg/dds301]

Abstract

While it is apparent that rare variation can play an important role in the genetic architecture of autism spectrum disorders (ASDs), the contribution of common variation to the risk of developing ASD is less clear. To produce a more comprehensive picture, we report Stage 2 of the Autism Genome Project genome-wide association study, adding 1301 ASD families and bringing the total to 2705 families analysed (Stages 1 and 2). In addition to evaluating the association of individual single nucleotide polymorphisms (SNPs), we also sought evidence that common variants, en masse, might affect the risk. Despite genotyping over a million SNPs covering the genome, no single SNP shows significant association with ASD or selected phenotypes at a genome-wide level. The SNP that achieves the smallest P-value from secondary analyses is rs1718101. It falls in CNTNAP2, a gene previously implicated in susceptibility for ASD. This SNP also shows modest association with age of word/phrase acquisition in ASD subjects, of interest because features of language development are also associated with other variation in CNTNAP2. In contrast, allele scores derived from the transmission of common alleles to Stage 1 cases significantly predict case status in the independent Stage 2 sample. Despite being significant, the variance explained by these allele scores was small (Vm< 1%). Based on results from individual SNPs and their en masse effect on risk, as inferred from the allele score results, it is reasonable to conclude that common variants affect the risk for ASD but their individual effects are modest.


A synthetic report on this paper may be found at The Spitoon.

This study seems to effectively discard any major genetic influence in autism and forces us to look again for environmental clues like environmental pollutants, pregnancy conditions, early parental care (such as breastfeeding), vaccines, etc. in order to understand the causes behind these problems. Per Wikipedia:

Environmental factors that have been claimed to contribute to autism or exacerbate its symptoms, or may be important to consider in future research, include certain foods, infectious disease, heavy metals, solvents, diesel exhaust, PCBs, phthalates and phenols used in plastic products, pesticides, brominated flame retardants, alcohol, smoking, illicit drugs, and vaccines.

Common pollutants, notably many common plastics, pesticides, etc., are high among the likely causes of the disorders, as well as many other modern diseases.

August 28, 2012

Bronze Age rock art in Azores

The claim, even if very unexpected, seems legitimate enough to have been made by the President of the Portuguese Association of Archaelogical Research (APIA), Dr. Nuno Ribeiro, within a conference titled "pre-Portuguese human presence in Azores, myth or reality?"

Among the findings cataloged in the last few years Ribeiro mentioned building remains that seem prehistorical, a Roman era inscription, a rock art site in Terceira island and several megalithic structures. Only in the last year, five tombs of the hypogeum kind and three sanctuaries also dug in the rock were located. All the findings are still pending radiocarbon dating however but the style of the rock art is similar to Bronze Age ones from Iberia. 

However red tape by the regional government is blocking further research: in 2011 for lack of financing and in 2012 for not being withing the frame of a legal decree.  The archaeologist denounced that all these extraordinary findings are therefore in state of abandonment. In one case, works in the local airport, carried without the corresponding archaeological survey, may have damage a site.

These findings strongly suggest that the navigation skills of Bronze Age peoples of the Eastern North Atlantic (Western Europe, NW Africa) were much more advanced than we usually admit.

Source: RTP[por] (h/t Pileta).

See also these articles in English language at the Portuguese American Journal: art1, art2.

Azores are located far away into the North Atlantic Ocean (CC by Tyk)

August 27, 2012

Early Neolithic boat and row fragments found in Korea


The remains were originally uncovered in 2005 in Ujin but only now it seems to have reached the international media. They are made of camphor wood and are stratigraphically from the Early Neolithic period (c. 8000 years ago). 

What remains of the boat is 3 meters long and 60 centimeters wide, whereas the original ship is thought to have been at least 4 meters long. 

The artifacts show how advanced carpentry was already in that period.

Sources and more details: Yahoo Groups: Austric, Korea Times, Yonhap, Delta World, Pileta[es].


Oldest Korean farm

In a related news item, the remains of the oldest known Korean farm were unearthed at Goseong earlier this year.

See: PhysOrg.

The site of the farm: lines indicate habitation or farming (white earlier, blue later)

August 25, 2012

Asturian mtDNA

Rock art from Asturias
A reader sent me a copy of a recent paper on the matrilineages of Asturias (in the northern parts of the Iberian Peninsula and part of the important Upper Paleolithic province known as the Franco-Cantarbrian region).

A. Pardiñas et al., Mitochondrial diversity patterns and the Magdalenian resettlement of Europe: new insights from the edge of the Franco-Cantabrian refuge. Journal of Human Genetics 2012. Pay per view ··> LINK [doi:10.1038/jhg.2012.100]

The authors identify what I understand is a false problem and try to find a solution but, as I see it, the whole matter lacks merit because instead of focusing on specific lineages like H, H1, H3, V, J or T2b (for example), they just discuss general haplotype diversity, what is pointless. 

Worse: they do so based only on HVS-I, which can only be considered a very mediocre proxy for actual lineage estimations, specially where haplogroups like H are dominant - because HVS-I usually says nothing or almost nothing about H and many of its subclades. 

So most of paper is just much ado about nothing, so to say. However the researches made an effort to quantify Asturian haplogroups (always with the limitation of using only HVS-I) and these results are of some interest, being the only reason why I mention this paper.

The mtDNA haplogroup (and paragroup!!!) frequencies of 429 Asturians (from various cities, all with Asturias-born maternal grandmother), based on HVS-I sequences, are as follows [haplogroup - absolute number (percentage)]:
  • R0 - 251 (58.5)
    • R0a - 1 (0.23)
    • HV -250 (58.3)
      • HV* - 2 (0.47)
      • H - 225 (52.4)
        • H* - 101 (23.54) 
        • H1 - 58 (13.5)
          • H1* - 53 (12.35)
          • H1a - 5 (1.17)
            • H1a - 1 (0.23)
            • H1a3 - 4 (0.93)
        • H2 - 14 (3.26)
          • H2a2b - 13  (3.03)
            • H2a2b* - 2 (0.47)
            • H2a2b1 - 11 (2.56)
          • H2b - 1 (0.23)
        • H3 - 30 (6.99)
        • H5 - 8 (1.86)
        • H6 - 11 (2.56)
          • H6* - 9 (2.10)
          • H6a1a1 - 2 (0.47)
        • H7a1 - 2 (0.47)
        • H9a - 1 (0.23)
      • HV0 - 17 (3.96)
        • HV0* - 8 (1.86)
        • V - 9 (2.10)
      • HV4 - 6 (1.40)
        • HV4a* - 3 (0.70)
        • HV4a1a - 3 (0.70)
  • U - 64 (14.92)
    • U* - 2 (0.47)
    • U1a2 - 1 (0.23)
    • U2'3'4'7'8'9 - 33 (7.69)
      • U4 - 11 (2.56)
        • U4* - 4 (0.93)
        • U4a - 7
          • U4a1 - 6 (1.40)
          • U4a3 - 1 (0.23)
      • U8 - 22 (5.13)
        • U8b - 4 (0.93)
        • K - 18 (4.20)
          • K* - 11 (2.56)
          • K1 - 7 (1.63)
            • K1a - 5 (1.17)
              • K1a1 - 2 (0.47)
              • K1a5 - 1 (0.23)
              • K1a11 - 1 (0.23)
            • K1b1a - 2 (0.47)
            • K1c2 - 1 (0.23)
          • K2b1 - 1 (0.23)
    • U5 - 23 (5.36)
      • U5* - 4 (0.93)
      • U5a - 11 (2.56)
        • U5a1 - 9 (2.10)
          • U5a1* - 7 (1.63)
          • U5a1b1 - 2 (0.47)
            • U5a1b1* - 1 (0.23)
            • U5a1b1e - 1 (0.23)
        • U5a2 - 2 (0.47)
      • U5b - 8 (1.86)
        • U5b1 - 7 (1.63)
          • U5b1* - 3 (0.70)
          • U5b1d - 4 (0.93)
        • U5b3 - 1 (0.23)
    • U6 - 5 (1.17)
  • JT - 93 (21.68)
    • J - 45 (10.49)
      • J* - 27 (6.29)
      • J1b1a1 - 8 (0.23)
      • J2 - 10 (2.33)
        • J2a1a - 1 (1.86)
        • J2b1a - 9 (2.10)
    • T - 48 (11.19)
      • T* - 5 (1.17)
      • T1 - 11 (2.56)
        • T1a* 10 2.33 (1.20–4.22)
        • T1a2a 1 0.23 (0.01–1.29)
      • T2 - 32 (7.46)
        • T2* - 2 (0.47)
        • T2b* - 20 (4.66)
        • T2b3a - 1 (0.23)
        • T2c - 3 (0.70)
        • T2e* - 1 (0.23)
        • T2e1 - 5 (1.17)
  • N1 - 6 (1.40)
    • N1* - 1 (0.23)
    • N1b* - 2 (0.47)
    • I - 3 (0.70)
      • I* - 1 (0.23)
      • I1a - 1 (0.23)
      • I2a - 1 (0.23)
  • W - 3 (0.70)
  • M1 - 3 (0.70)
    • M1* - 2 (0.47)
    • M1b1 - 1 (0.23)
  • D4g1 - 1 (0.23)
  • L3f1b4a - 5 (1.17)
  • L2a - 1 (0.23)
  • L1b - 1 (0.23)

A lot more research, with full coding region sequencing if possible, needs to be done in high "asterisk" haplogroups like H* (24%), H1* (13%), H3 (7%), H6*, HV0*, V, K*, U5*, J*, T1a* or T2b*. Hopefully next time.

Lactose tolerance favors obesity

While the lactose tolerance allele may have some positive health effects, notably because milk is one of the few good dietary sources of calcium, it seems to correlate also with some negative effects, namely obesity.

Ricardo Almon et al., Association of the European Lactase Persistence Variant (LCT-13910 C>T Polymorphism) with Obesity in the Canary Islands. PLoS ONE 2012. Open access ··> LINK [doi:10.1371/journal.pone.0043978]

Canary Islands, in spite of its subtropical geography, is one of the regions of the European Union where milk is most consumed, at levels comparable to Scandinavia. 

Although there is a strong correlation between being lactose tolerant and milk consumption it is not fully clear yet if it is excess milk consumption what makes people obese or an unknown collateral effect of the European lactase persistence allele.

Interestingly the correlation, very strong, is only found for obesity and not for being overweight:

Fig. 1 - BMI classification by LCT genotypes (LP: n = 330; LNP: n = 221)

August 24, 2012

Neolithic ship and obsidian cargo found near Naples

A sunken vessel has been discovered off the island of Capri (Campania, Italy), not far from Naples. The ship, whose details are unknown to me at the time of writing it, was tentatively dated to at least c. 5000 years ago, in the Neolithic (or earliest Chalcolithic) period. It carried a load of obsidian, a prime quality material for tools and weapons (which is said to produce sharper edges than modern surgical scalpels).

Sadly, I could not find much information on this most interesting discovery. I wonder if the obsidian was extracted from the Campi Flegrei at Naples Bay and who may have been demanding such a large cargo?

Archaeological map of Capri: red: Neolithic, yellow: Chalcolithic, other: later periods
(CC by Morn)


Sources: ANSA, Pileta.

Adaptionism (humor)

From the often great comic strip (cum video theater) Saturday Morning Breakfast Cereal:


Some chimp-human differences are epigenetic

Nothing related to brain function this time but rather to attributes that our jungle cousins seem to be at advantage compared to us. Notably chimpanzees almost never have cancer or some other diseases, like mental disorders, which we suffer a lot. This new research suggests it may be because of low methylation levels in humans (i.e. epigenetics, hinting at environmental causes rather than pure inheritance).

Jia Zeng et al., Divergent Whole-Genome Methylation Maps of Human and Chimpanzee Brains Reveal Epigenetic Basis of Human Regulatory Evolution. AJHG 2012. Pay per view (free after 6 months embargo) ··> LINK [doi:10.1016/j.ajhg.2012.07.024]

Abstract

DNA methylation is a pervasive epigenetic DNA modification that strongly affects chromatin regulation and gene expression. To date, it remains largely unknown how patterns of DNA methylation differ between closely related species and whether such differences contribute to species-specific phenotypes. To investigate these questions, we generated nucleotide-resolution whole-genome methylation maps of the prefrontal cortex of multiple humans and chimpanzees. Levels and patterns of DNA methylation vary across individuals within species according to the age and the sex of the individuals. We also found extensive species-level divergence in patterns of DNA methylation and that hundreds of genes exhibit significantly lower levels of promoter methylation in the human brain than in the chimpanzee brain. Furthermore, we investigated the functional consequences of methylation differences in humans and chimpanzees by integrating data on gene expression generated with next-generation sequencing methods, and we found a strong relationship between differential methylation and gene expression. Finally, we found that differentially methylated genes are strikingly enriched with loci associated with neurological disorders, psychological disorders, and cancers. Our results demonstrate that differential DNA methylation might be an important molecular mechanism driving gene-expression divergence between human and chimpanzee brains and might potentially contribute to the evolution of disease vulnerabilities. Thus, comparative studies of humans and chimpanzees stand to identify key epigenomic modifications underlying the evolution of human-specific traits.

See also the article at Science Daily.

August 23, 2012

Increased complexity in certain regions sets apart human and chimp brains

Frontal lobe (CC-BY-SA-2.1-jp)
This paper looks like a very important research piece for the understanding of the human mind, of what makes our brains specifically human and ultimately of what makes ourselves what we are.

Genevieve Konopka et al., Human-Specific Transcriptional Networks in the Brain. Neuron 2012. (Freely accessible apparently) ··> LINK [doi:10.1016/j.neuron.2012.05.034]

Summary

Understanding human-specific patterns of brain gene expression and regulation can provide key insights into human brain evolution and speciation. Here, we use next-generation sequencing, and Illumina and Affymetrix microarray platforms, to compare the transcriptome of human, chimpanzee, and macaque telencephalon. Our analysis reveals a predominance of genes differentially expressed within human frontal lobe and a striking increase in transcriptional complexity specific to the human lineage in the frontal lobe. In contrast, caudate nucleus gene expression is highly conserved. We also identify gene coexpression signatures related to either neuronal processes or neuropsychiatric diseases, including a human-specific module with CLOCK as its hub gene and another module enriched for neuronal morphological processes and genes coexpressed with FOXP2, a gene important for language evolution. These data demonstrate that transcriptional networks have undergone evolutionary remodeling even within a given brain region, providing a window through which to view the foundation of uniquely human cognitive capacities.


Hippocampus (CC-BY-SA-2.1-jp)
For what I could understand, mostly from the press release, the authors unveiled increased complexity of the gene expression modulating three regions of our brains: the frontal cortex, the hippocampus and the striatum.

It is not a mere matter of size but specially one of much increased complexity in the wiring of these three regions what seems to make our brains unique. 

The research also reinforces the apparent importance of the much debated genes CLOCK (affecting circadian rhythms, mood, pregnancy and metabolism), FOXP1 and FOXP2 (related specially with speech), whose connectivity is much increased in humans in comparison with our ape cousins.

August 21, 2012

Ancient Homo sapiens from Laos (46-63,000 years ago)

Tam-Pa-Ling skull
While this is not the only nor even probably the oldest remain of the so-called anatomically modern humans (i.e. Homo sapiens, our kin) in Eastern or SE Asia, it seems to be the less controversial one so far, what should help to consolidate our knowledge of the period of colonization of the Eurasian region East of Bengal.

Fabrice Demeter et al., Anatomically modern human in Southeast Asia (Laos) by 46 ka. PNAS 2012. Pay per view (6 months embargo) ··> LINK [doi:10.1073/pnas.1208104109]

Abstract

Uncertainties surround the timing of modern human emergence and occupation in East and Southeast Asia. Although genetic and archeological data indicate a rapid migration out of Africa and into Southeast Asia by at least 60 ka, mainland Southeast Asia is notable for its absence of fossil evidence for early modern human occupation. Here we report on a modern human cranium from Tam Pa Ling, Laos, which was recovered from a secure stratigraphic context. Radiocarbon and luminescence dating of the surrounding sediments provide a minimum age of 51–46 ka, and direct U-dating of the bone indicates a maximum age of ∼63 ka. The cranium has a derived modern human morphology in features of the frontal, occipital, maxillae, and dentition. It is also differentiated from western Eurasian archaic humans in aspects of its temporal, occipital, and dental morphology. In the context of an increasingly documented archaic–modern morphological mosaic among the earliest modern humans in western Eurasia, Tam Pa Ling establishes a definitively modern population in Southeast Asia at ∼50 ka cal BP. As such, it provides the earliest skeletal evidence for fully modern humans in mainland Southeast Asia.

Some more details can be found at the press release by the University of Illinois (h/t Pileta).

There are some skulls and skull fragments from East Asia that can be actually older than this one but they may be less straightforward either in their dating or their identification as Homo sapiens:

  • Liujiang skull (at Don's Maps, at P. Brown's site, at Bradshaw Foundation), from Guangxi-Zhuang, is clearly a modern Homo sapiens but the exact date is not known because it was originally dug with very limited means. Recent datings of nearby sediment suggest an age of 68-139 Ka but this is hotly debated.
  • Zhirendong jaw (at this blog, at PhysOrg), also from Guangxi-Zhuang and dated to before 100,000 years ago (110,000 years ago according to first reports), is argued to be a modern Homo sapiens but its very ancient date and some unavoidable ambiguity of such limited skeletal evidence allow for some skepticism, if you are so inclined.
  • Callao cave metatarsal (foot) bone (at Leherensuge) is dated to before 67,000 years ago and comes from Luzon, the largest Filipino island, but because of its small size cannot be ascribed to any human species safely. All we can say is that they knew how to use rafts or boats - but then Homo floresiensis (H. erectus?) did too. 
  • Also some non-skeletal evidence to consider:

Whichever is your personal take, it is clear that this skull adds up in support of a very old colonization of East Asia. The question is: exactly how old?


Update: a creative reconstruction by H. Zänder:

Upper Paleolithic of North China c. 30,000 years ago

Shuidonggou (Ningxia-Hui) looks like a promising site that should help to clarify the arrival and development of Upper Paleolithic (or, as they say, Late Paleolithic - mode 4 in any case) in East Asia. As far as I know, this is the oldest known Upper Paleolithic site East of Altai, at least of any relevance. Not long ago, the arrival of UP technologies to East Asia was believed to be some ten thousand years more recent - a reminder that we should always consider earliest known dates for anything as a terminus ante quem and not anything near absolute until a proper, consolidated, research seems to leave little room for further doubt.

Shuwen Pei et al., The Shuidonggou site complex: new excavations and implications for the earliest Late Paleolithic in North China. Journal of Archaeological Science, 2012. Pay per view ··> LINK [doi:10.1016/j.jas.2012.06.028]

Abstract

The initial Late Paleolithic, said to appear between 40 and 30 kya in eastern Asia, is defined by the appearance of many innovations. These archaeological indicators include the appearance of more refined stone tool making techniques (e.g., include the appearance of blade and microblade technology), complex hearth construction, use of pigments and personal ornamentation, as well as worked faunal implements such as bone and antler tools. We report here new findings from a multidisciplinary research project conducted at the Shuidonggou (Choei-tong-keou) site complex in northern China, a series of localities that date from the initial Late Paleolithic to the Neolithic.

Six new localities (SDG7–12) were discovered and five localities [SDG2 (previously identified) and SDG7–9 and 12] were excavated, yielding more than 50,000 stone artifacts, fauna, ostrich eggshell beads, and hearths. Dating results suggest that human occupation of the Shuidonggou area occurred during the Late Pleistocene to Middle Holocene (∼32,000–6000 BP). Some sites are characterized by small, irregular flakes, casually retouched tools [modified or informally retouched tools (i.e., non-standardized tools with sporadic retouch which was not well controlled)], and small numbers of blades or no blades. Others lithic assemblages are dominated by blades and microblades. At two sites, higher quality or exotic raw materials were exploited, but at the majority of sites locally-available river cobbles were used. In addition to blades, microblades and hearths, more than 80 finely-perforated and polished ostrich egg-shell beads, mostly colored with red ochre, were recovered from three sites. Several worked bone needles and an awl were also uncovered from the youngest site, SDG12, in deposits dating to c. 13,000 cal BP. The implications for the initial appearance of the Late Paleolithic in China and movement of modern human populations into North China are discussed.

Some more detailed information, for those without deep pockets or institutional access, is available at PhysOrg, where it is explained that the complex includes five different sites and was inhabited between c. 32,000 and 6000 BP, most intensely in two different periods: (1) 32-24,000 BP and (2) 13-11,000 BP.

The assemblages include blades and microblades, large numbers of vertebrate fossils, some ostrich eggshell beads, hearths, pigments and bone tools. 


H/t Pileta.

See also this earlier paper by D.B. Madsen et al. on the same site ··> LINK (PDF).

August 20, 2012

The height of Europeans and the myth of the North-South cline

I was just reading on the alleged genetics of height among Europeans and the first thing that stroke me was that the whole story totally assumed from the beginning that Northern Europeans are taller than Southern ones.

While there may be a seed of truth to that stereotype, the reality is much more complex. Just some quick work on known average heights for Europeans gives us the following facts:


Men:

Hierarchically sorted avg. height of 28 European populations (men):
Red: tallest (180-182 cm)
Magenta: medium (177-179 cm)
Blue: shortest(174-176 cm)


Women:

Hierarchically sorted avg. height of 28 European populations (women):
Red: tallest (167-169 cm)
Magenta: medium (164-166 cm)
Blue: shortest(160-163 cm)

Note: the 3-segment division in the men's map was straightforward because the range of national average was of 9 cm, so 3 cm variation for each, right? However, in the case of women the max. difference is of 10 cm instead but, when we exclude Turkey, only 8 cm, so the shortest segment spans some 4 cm of variation but only 2 cm for Europe senso stricto, so I understand that it is a fair and informative segment after all.


Discussion:

There are some clear facts:
  1. The highest population seems to be the Dutch.
  2. The area of greatest height, rather than strictly Northerner seems to be Central European, with only some Northerner tendency.
  3. The area of least overall height seems to be towards Turkey but there is no clear or simple regional structure of this factor generally speaking.
  4. Some Northern European populations (Great Britain, Finland) have very short women. Their men are not that tall either.
  5. Some Southern European populations (notably Spaniards and Greeks, and of course Croats) are not short at all.
  6. French, Swiss and Hungarian men are rather short for their neighbors' standards, what might be related (just a quick hunch) with the dominance of the "Alpinoid" phenotype.
In any case, we can't say too happily that Northern Europeans are taller than Southern ones without at least some qualifications.

August 19, 2012

Pyrenean Neolithic cave of El Trocs (Bisagorri)

Pottery fragment
After four research seasons the Aragonese site of El Trocs (Bisagorri[ara], Ribagorza) reveals a seasonally occupied shepherd shelter. The inhabitants knew of wheat but did not grow it anywhere near the cave. 

The findings, a long way before publication as of now, go through six different and intact layers from c. the 6th millennium BCE (early Neolithic) and include faunal remains, pottery and awls.

Also some skeletal remains, from several individuals and possible de-fleshing marks (cannibalism?) have been revealed. 

An unusual antropomorphic figure is also drawn on the walls but the chronology of this artwork is unknown:


Sources[es]: Patrimonio Cultural de Aragón (incl. video), Radio Huesca, Pileta.

August 17, 2012

Smashed faces of Neolithic Syrian skulls

Don't ask me how can archaeologists work in Syria with all the ongoing war. I can only presume that it is just publication of last years' research.

Whatever the case, it has been known these days that a number of skulls in burials from the Southern Syrian Neolithic site of Tell Qarassa, contextualized in the Pre-Pottery Neolithic B (PPNB), show the strange feature of having their faced smashed, probably upon reburial of the skulls separated from the bodies, years after the first burial.

Of the 12 skulls, all belonging to young males, one was smashed to pieces, one (of a child) was intact and the other 10 had their faces smashed through.

The exact meaning of this post-mortem performance is unknown but researchers speculate that it may be related to fear of the ghosts of the dead ones: some kind of exorcism.

J. Santana et al., Crania with mutilated facial skeletons: A new ritual treatment in an early Pre-Pottery Neolithic B cranial cache at Tell Qarassa North (South Syria). American Journal of Physical Anthropology, 2012. Pay per view ··> LINK [doi:10.1002/ajpa.22111]

Source and more details at New Scientist and Pileta.

A simple genetic cause for larger ape and human brains?

The copy number of a protein-making gene, DUF1220, which has been related in humans with microcephaly, may underly the extra size of our brains and therefore that of our rather unique intelligence.

Laura J. Dumas, DUF1220-Domain Copy Number Implicated in Human Brain-Size Pathology and Evolution. AJHG 2012. Pay per view (freely accessible after 6-month embargo) ··> LINK [doi:10.1016/j.ajhg.2012.07.016]

Humans have more than 270 copies of DUF1220 encoded in the genome, far more than other species. The closer a species is to humans, the more copies of DUF1220 show up. Chimpanzees have the next highest number, 125. Gorillas have 99, marmosets 30 and mice just one. "The one over-riding theme that we saw repeatedly was that the more copies of DUF1220 in the genome, the bigger the brain. And this held true whether we looked at different species or within the human population."

Source: Science Daily.

Qualifying diversity in bovine cattle

There is a new open access paper for all those with interest in the genetic history of cows:

Deirdre C. Purfield et al., Runs of homozygosity and population history in cattle. BMC Genetics, 2012. Open access ··> LINK [doi:10.1186/1471-2156-13-70]

The runs of homozygosity (ROH) are used to qualify the nature of the inbreeding (endogamy) process where it exists. When the ROHs are short (for example among Malagassy Zebu), that indicates that the genome has been recombined and fragmented many times, while when the ROH are longer, it can be inferred that inbreeding process is recent, as happened in Jersey and Guernsey, who applied strict cattle regulations since the 19th century.

Fig. 6 - minimally annotated by me
Figure 6 Average sum of Runs of Homozygosity (ROH) per bovine SNP50 animal <20 Mb in length within breed VS average sum of ROH >20 Mb in length. Breeds that originate from the same geographical area tend to cluster together with African Bos taurus breeds showing low levels for both measures, except for the Somba, Oulmès Zaer and Lagune breeds where elevated levels were clearly highly influenced by long ROH whereas the zebu breeds showed intermediate values of ROH but these were more strongly influenced by shorter ROH

The full names of the breeds are:
  • African taurines: Baoule (BAO), Lagoude (LAG), N'Dama (NDA), Oulmès Zaer (OUL),  Somba (SOM)
  • African hybrids: Kuri (KUR), Sheko (SHK)
  • African zebu: Zebu Bororo (ZBO, Zebu Fulani (ZFU), Zebu from Madagascar (ZMA)
  • British Isles: Angus (ANG), Guernsey (GNS), Hereford (HFD), Jersey (JER), Red Angus (RGU)
  • Northern Europe: Bretonne Pied Noire (BPN), Holstein-Friesian (HOL), Maine-Anjou (MAN) Maraichine from Parthenaise (MAR), Monbeliard (MON), Normande (NOR), Norwegian Red Cattle (NRC), French Pied Rouge Lowland (PRP)
  • Central/SW France: Aubrac (AUB), Charolais (CHL), Charolais from UK (CHA), Gascon (GAS), Limousin (LMS), Salers (SAL)
  • Alpine: Abondance (ABO), French Brown Swiss (BRU), Brown Swiss (BSW), Piedmontese (PMT), Romagnola (RMG), Tarine (TAR), Vosgienne (VOS)
  • Zebus: Beef Master (BMA), Brahman (BRM), Gir (GIR), Nelore (NEL), Santa Gertrudis (SGT)

Aragonese rock art at risk because of mine

The negligence in the processing of the declaration as cultural good of the rock art of Villarluengo (Teruel province, Aragón, Iberia), which was delayed for five years, has allowed the mining company to win an appeal to the Spanish Supreme Court, allowing them to continue with their destructive business regardless of the cave art, which is now endangered.

Sources[es]: La Comarca, Pileta.

Thousands of engraved plates found in Northern Portugal

The engraved schist plates have been found concentrated at a dig site at Meirinhos[pt] (Mogadouro, Alto Trás-os-Montes), where they seem to have accumulated by the action of natural forces back in the day. Their motifs are mostly figurative, although some are zoomorphic (horses, aurochsen). They are believed to be from the Upper Paleolithic and are among the most important artistic sets of NW Iberia (also Côa open air sanctuary and Asturian cave art).

Sources[pt]: Correio del Manha, Pileta,

August 16, 2012

Ötzi was much more Neanderthal than usual

Paleoanthropologist John Hawks mentions today in his blog that he and colleagues have found that the famous Neolithic mummy Ötzi's genome is much more Neanderthal than modern day Europeans and Asians. Almost double in fact:


So if the average modern European is (est.) 2.4% Neanderthal, Ötzi could well be some 4.5-4.8%. What is less clear is whether this means a Paleolithic residue of excess Neandethal blood or a Neolithic arrival of excess Neanderthal blood from West Asia, if this can be extrapolated to all Europe or some wider region or was instead restricted to Italy (which stood apart from the main late Upper Paleolithic currents) or even a peculiarity of Ötzi's ethnic group (La Lagozza culture, part of the wider Cardium-Pottery cultural phenomenon). 

In December I detected anomalous high FST distances in an autosomal component of some Alpine populations, specifically a component important in the 1000 Genomes' Slovene sample (22%) but not in any other West Eurasian population I could observe (values of <2%). As I said back in the day, it may be some sort of error, but I wouldn't mind if the matter was further researched. If not an error, it could be a residual component from the "Out of Africa" period, judging from the FST value. Take all this with lots of salt, of course, just trying to explore possible explanations. 

August 15, 2012

Positive selection for arthritis and short-size alleles in Eurasia?

That is what a new paper suggests for two SNPs whose derived allele is very common outside Africa and non-existent in Africa.

Dong-Dong Wu et al., Positive Selection on the Osteoarthritis-Risk and Decreased-Height Associated Variants at the GDF5 Gene in East Asians. PLoS ONE, 2012. Open access ··> LINK [doi:10.1371/journal.pone.0042553]

Abstract

GDF5 is a member of the bone morphogenetic protein (BMP) gene family, and plays an important role in the development of the skeletal system. Variants of the gene are associated with osteoarthritis and height in some human populations. Here, we resequenced the gene in individuals from four geographically separated human populations, and found that the evolution of the promoter region deviated from neutral expectations, with the sequence evolution driven by positive selection in the East Asian population, especially the haplotypes carrying the derived alleles of 5′ UTR SNPs rs143384 and rs143383. The derived alleles of rs143384 and rs143383, which are associated with a risk of osteoarthritis and decreased height, have high frequencies in non-Africans and show strong extended haplotype homozygosity and high population differentiation in East Asian. It is concluded that positive selection has driven the rapid evolution of the two osteoarthritis osteoarthritis-risk and decreased height associated variants of the human GDF5 gene, and supports the suggestion that the reduction in body size during the terminal Pleistocene and Holocene period might have been an adaptive process influenced by genetic factors.


Figure 3. World-wide allele frequency distribution of the two SNPs rs143384 and rs143383.

Besides any possible selective pressure, a quick look at both maps shows that there is nearly total linkage disequilibrium among these two loci of chromosome 20. Finding a difference between both maps is practically impossible.

The second allele, rs143383(T), is particularly notorious for its correlation with osteoarthritis (+30% risk with the homozygous variant, +10% risk with the heterozygous one). Interactively with other SNPs, it may also affect height. The other one, rs143384(T) also shows some (epigenetically modified) association with osteoarthritis and congenital hip dislocation. 

Notice please that the use of G/A or C/T nomenclature is arbitrary because each G has a C pair at the other side of the double helix and each A a T one. This can be confusing for the occasional reader however.

The authors think that these two alleles should never have reached such high frequencies in such a short time (c. 100,000 years since the OoA) unless they were subject to marked positive selection. 

However I can only imagine that the opposite is equally possible: that the derived alleles once existed but have been eradicated in Africa because of negative selection but have remained common in Eurasia because of a bad founder effect which only gradually is being eroded. If nothing else, food for thought.

The authors also suggest that this positive selection factor might have been reduction in body size for which the cite a couple of papers (Ruff 2002 and Hawks 2011) which actually fail to determine such claim. The first one actually deals with bone robustness, not length and therefore not height, the latter is about endocranial size, which may be related to intelligence but not too directly to height. 

It seems clear that, on average, we are plausibly dumber, weaker and more androgynous than our Paleolithic ancestors but not that we are shorter in fact. 

So, allow me please to remain healthily skeptic, even if the data presented in this paper is interesting in its own right; even though the interpretative proposal of the authors is plausible we must keep open other possibilities, specially as we do not know yet what such a conjectured selective pressure may have been (arthritis offers no obvious advantages, mind you). 

Notably a bad founder effect phenomenon should be considered or, also the similar possibility of this allele offering its positive side only in combination with another deleterious variant, in one of those exceptional cases in which two wrongs make one right. This could be more easily be determined if we knew more of the genetics of Homo sapiens in the Paleoithic.

August 13, 2012

Neanderthal allele located in non-African modern humans

This should be of some interest:

Fernando L. Méndez et al., A Haplotype at STAT2 Introgressed from Neanderthals and Serves as a Candidate of Positive Selection in Papua New Guinea. AJHG 2012. Pay per view (for six months) ··> LINK [doi:10.1016/j.ajhg.2012.06.015]

Abstract

Signals of archaic admixture have been identified through comparisons of the draft Neanderthal and Denisova genomes with those of living humans. Studies of individual loci contributing to these genome-wide average signals are required for characterization of the introgression process and investigation of whether archaic variants conferred an adaptive advantage to the ancestors of contemporary human populations. However, no definitive case of adaptive introgression has yet been described. Here we provide a DNA sequence analysis of the innate immune gene STAT2 and show that a haplotype carried by many Eurasians (but not sub-Saharan Africans) has a sequence that closely matches that of the Neanderthal STAT2. This haplotype, referred to as N, was discovered through a resequencing survey of the entire coding region of STAT2 in a global sample of 90 individuals. Analyses of publicly available complete genome sequence data show that haplotype N shares a recent common ancestor with the Neanderthal sequence (∼80 thousand years ago) and is found throughout Eurasia at an average frequency of ∼5%. Interestingly, N is found in Melanesian populations at ∼10-fold higher frequency (∼54%) than in Eurasian populations. A neutrality test that controls for demography rejects the hypothesis that a variant of N rose to high frequency in Melanesia by genetic drift alone. Although we are not able to pinpoint the precise target of positive selection, we identify nonsynonymous mutations in ERBB3, ESYT1, and STAT2—all of which are part of the same 250 kb introgressive haplotype—as good candidates.
According to Wikipedia, STAT2 is a gene which offers immunity against adenoviruses, which are related to respiratory illnesses (common cold, pneumonia, bronchitis...) and some other common diseases like conjunctivitis or gastroenteritis. Most infections are mild and require no specific treatment.

This suggests me that the selective pressure was quite weak, if any at all, so its introgression is most likely the product of a fluke and not selection. However it is not totally impossible that in the past some viral strain was particularly deadly causing adaptive selection.

(Slashed out text is edited: wrong notions)

Whatever the case it is also interesting to take a look at SNPedia, which lists five SNPs in this gene:
  • Rs1883832 - whose T variant is almost exclusively non-African
  • Rs4810485 - whose T variant is also almost exclusively non-African
  • Rs2066808 - whose T variant is dominant outside Africa but also somewhat common in Africa
  • Rs1927914 - whose T variant is dominant outside Africa but also somewhat common in Africa
  • Rs10983755 - whose A variant is almost exclusive of East Asians

I can only imagine (as I have not got access to the paper, so I can't double check)  that the introgressed haplotype includes the first two SNPs in their T variants (see below). If so, the Neanderthal allele should cause: increased risk of osteopenia in women, some increase in the likelihood of lymphoma, among other things (arthritis, asthma?) which I'm not sure about. I do not see any indication of the haplotype being beneficial in any way but you tell me. 

Hat tip to Jean.


Update: I just got a copy of the paper, so I share these key figures:


We can see in them that the genomic positions at 55,030,689, 55,030,712 and 55,036,471 do not seem to correspond with the SNPs listed in SNPedia (so my previous inference was wrong, it seems).

We can also see in the map how the haplotype N is distributed in what would seem to be random founder effects.

There is a chance that the Denisova variant (haplotype D) is found in some Papuans but being described by just a single transition this is not certain.

As you know I dislike molecular-clock-o-logy, which I consider close to pseudoscience but considering that there has been some paper recently claiming (as they usually do: as if it was rocket science instead of a mere educated guess) low divergence ages for Neanderthals and H. sapiens, I feel almost obliged to mention that this paper estimates the haplotype divergence at some 500-731 Ka., what, after correcting for the usual under-estimate of the Pan-Homo divergence, can be consistent with the classical archaeological understanding of the Neanderthal-Sapiens divergence before a million years ago, with the spread of Acheulean and H. heidelbergensis.

August 11, 2012

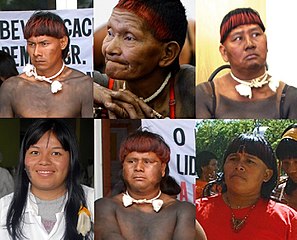
The Xavantes as genuine unmixed Native Americans

Xavantes (cc Agência Brasil)
A new paper proclaims that Xavantes appear to be one of the less mixed and or more genetically distinctive Native American people of present day.

Patricia C. Kuhn et al., Genome-Wide Analysis in Brazilian Xavante Indians Reveals Low Degree of Admixture. PLoS ONE 2012. Open access ··> LINK [doi: 10.1371/journal.pone.0042702]

Abstract

Characterization of population genetic variation and structure can be used as tools for research in human genetics and population isolates are of great interest. The aim of the present study was to characterize the genetic structure of Xavante Indians and compare it with other populations. The Xavante, an indigenous population living in Brazilian Central Plateau, is one of the largest native groups in Brazil. A subset of 53 unrelated subjects was selected from the initial sample of 300 Xavante Indians. Using 86,197 markers, Xavante were compared with all populations of HapMap Phase III and HGDP-CEPH projects and with a Southeast Brazilian population sample to establish its population structure. Principal Components Analysis showed that the Xavante Indians are concentrated in the Amerindian axis near other populations of known Amerindian ancestry such as Karitiana, Pima, Surui and Maya and a low degree of genetic admixture was observed. This is consistent with the historical records of bottlenecks experience and cultural isolation. By calculating pair-wise Fst statistics we characterized the genetic differentiation between Xavante Indians and representative populations of the HapMap and from HGDP-CEPH project. We found that the genetic differentiation between Xavante Indians and populations of Ameridian, Asian, European, and African ancestry increased progressively. Our results indicate that the Xavante is a population that remained genetically isolated over the past decades and can offer advantages for genome-wide mapping studies of inherited disorders.

The Xavantes, comprising today some 10,000 people, have suffered repeated hostility from the Western civilization in Brazil since centuries ago. In spite of all they have managed to remain proud and distinct.

Fig. 2 three-dimensional global PCA with emphasis in American populations

Fig. 3 (edited by me: only the labeling): neighbor-joining global tree

August 8, 2012

Ample analysis of the genetics of European (Ashkenazi) Jews

A new paper on European (Ashkenazi) Jewish genetics is available:

Ehran Elhaik, The Missing Link of Jewish European Ancestry: Contrasting the Rhineland and the Khazarian Hypotheses. arXiv 2012. Open access. [arXiv:1208.1092v1 [q-bio.PE]]

(Supplemental material available HERE). 

The author prefers to use the term European Jews to that of Ashkenazi, because Ashkenaz is traditionally Germany and this may imply certain assumptions about the origins of this population, i.e. the Rhineland model, which he intends to contrast with the Khazar model and what he calls the Judean model

No intention exists in all the paper of investigating the Anatolian model, by which Western Jews would be descendants, in essence, not so much of Iron Age Jews from Palestine (Judean model) but neither from Europeans, be them Western (Rhineland model) or Eastern (Khazar model), but rather of Hellenistic converts from areas like Cilicia or Cyprus.

This alternative model is clearly supported by autosomal genetics, in this and previous papers. However haploid genetics seems to point to different sources.

In the paper, European Jews were roughly subdivided into Eastern (Belorussia, Latvia, Poland, and Romania) and Central (Germany, Netherland, and Austria) European Jews: EEJ and CEJ respectively in the graphs. They show some but not well defined structure however.

I'd say that the core of the paper's interest is in the following graphs:


1. Autosomal PCA:

Fig. 3 PCA scatterplot of West Eurasians (click to enlarge)

Again, as in previous analysis, including mine, Western Jews, in this case the European or Ashkenazi subgroup appears to cluster near Cypriots, suggesting a Southern Anatolian main origin (Tarsus area) very likely. However this region (ancient Cilicia) is still to be directly compared with Jews (I know it's just it's fine tuning but still when you have a theory, you'd like to see it reality-checked).

Another possibility would be hat this clustering is an artifact, assuming diverse origins homogenized by Jewish endogamy since the Middle Ages. But the fact that all three Western European subpopulations (Ashkenazi, Sephardi and Moroccan) tend to cluster over there (when they do not behave as fully distinct, as happened to me with all but Sephardites earlier this year).

Not shown here is fig. 7 that lists proportions of shared IBDs with West Asian and Caucasus populations (only): Caucasians are highest (roughly 9%), followed by Palestinians (c. 7%), while most groups are at c. 5% (except Lebanese who are at c. 3%).

In general this data supports some but limited Palestinian connection and a much more northernly origin of Western (or at least Ashkenazi) Jews. This is consistent with previous data (see below).


2. Haploid or uniparental relations:

Fig. 7 Relative affinity of (A) mtDNA and (B) Y-DNA of European Jews

Note please that the map is awfully drawn in some key details, for example the dark areas in Kurdistan correspond in fact to Lezgian (from Daghestan, in the NE Caucasus) and another one I don't discern well but that begins with I and hence must be an Iranian or Indian group, not Kurdish. The center of the "Kurdistan" affinity hotspot must be hence much farther NE, in Daghestan or Azerbaijan.

So by uniparental lineages, European Jews do appear as a mixture of Western (strongest in Y-DNA) and Caucasian lineages (strongest in mtDNA), supporting both the Rhineland and the Khazar hypothesis in a combined way. However no comparison with Cypriots nor Southern Turks was made, and these are the populations to whom Western Jews show most direct affinity by autosomal DNA, being Cilicia one, if not the largest, hotspot of the Jewish Diaspora in the Roman Era, a most likely realistic origin for


See also previous analysis:
 

August 4, 2012

Claim first known lighters from Palestine Neolithic

A new study claims that cilindro-conic artifacts and holed items found in Yarmukian Pottery Neolithic sites (6th millennium BCE) are the first known fire-making artifacts and not, as had been argued previously, ritual or cultural objects such as idols or game boards.

Naama Goren-Inbar et al., The Earliest Matches. PLoS ONE, 2012. Open access ··> LINK [DOI: 10.1371/journal.pone.0042213]

Abstract

Cylindrical objects made usually of fired clay but sometimes of stone were found at the Yarmukian Pottery Neolithic sites of Sha‘ar HaGolan and Munhata (first half of the 8th millennium BP) in the Jordan Valley. Similar objects have been reported from other Near Eastern Pottery Neolithic sites. Most scholars have interpreted them as cultic objects in the shape of phalli, while others have referred to them in more general terms as “clay pestles,” “clay rods,” and “cylindrical clay objects.” Re-examination of these artifacts leads us to present a new interpretation of their function and to suggest a reconstruction of their technology and mode of use. We suggest that these objects were components of fire drills and consider them the earliest evidence of a complex technology of fire ignition, which incorporates the cylindrical objects in the role of matches.

Rather than matches I would use the analogy of lighters if any because matches by definition have a chemical head that burns with friction, while lighters can have many designs and traditionally often used, like these, friction to ignite a wick or tinder (example). 

The kind of fire-making the authors suggest resemble more the style used by Bushmen and other peoples in which a stick is energetically rolled inside a small plank, until it achieves enough heat by friction to set some tinder alight. 

Often friction is generated just using the hands but in other cases the string of a bow is used instead (right). 

This last seems to be what the authors suggest to have been the case with the strange artifacts:

Fig.3 - Fired-clay cylindrical artifacts


Fig. 6 - Kfar HaHoresh limestone artifacts interpreted as fire boards

In support for their case the mention that the Egyptian hieroglyph for fire is a fire drill with the bow method, precisely their suggested method, based on some grooves arguably made by strings, however I could not confirm this extreme because the Internet is full of all things pseudo-Egyptian and basic introductory pages to the most complex Egyptian hieroglyph writing system (similar in the general concept to Chinese script, for instance) do not go that far. 

I would not anyhow discard the game board notion myself but your call.