December 10, 2012

Romani autosomal genetics

French Gitanes (Roma)
CC by Fiore S. Barbato
If a few days ago I mentioned the study by Rai et al. of Romani Y-DNA, which locate their origins with great certainty in the NW reaches of the Indian subcontinent, specifically among the lower castes, now I must echo this other study, still in pre-publication stage, which deals with the autosomal genetics of the same European minority.

Priya Moorjani et al., Reconstructing Roma history from genome-wide data. arXiv 2012. Freely accessibleLINK [ref. arXiv:1212.1696]

The authors studied the nuclear genome of 27 Romani individuals from six populations of four European states: Hungary (three different populations), Romania, Slovakia and Spain. 

A reasonable complaint at this stage could be that the size of the sample is small and very specially too concentrated in a very specific area: the Middle and Lower Danube region. But, well, let's assume that is not too important. 

The authors appear to confirm the NW Indian ancestral affinities of the Roma, however it seems obvious that they have been heavily admixed with Europeans since their migration a thousand years ago. 

The tests performed on this regard find greater affinity to Romanians than other Europeans but no other Balcanic nor West Asian peoples were tested for, so some question marks remain open. Certainly it is a bit puzzling that with all the worldwide comparisons performed in this paper not a single West Asian population was included. 

There are hence some shortcomings in the sampling and analysis strategy (why to compare with tropical Africans but not with Iranians, Turks, Egyptians or Arabs?) but the study still deserves a mention. 

Principal component analysis:


STRUCTURE  analysis:


December 7, 2012

Epipaleolithic settlement found near Liverpool

A small Epipaleolithic hamlet has been discovered this Summer at Lunt Meadows, near Sefton (Merseyside County, which also includes the city of Liverpool).

The findings include flint, pebble and chert tools, and the remains of three large houses, up to six meters across. Therefore researchers infer that this people were semi-sedentary, challenging the notion of hunter-gatherers being always on the move (which is also not the case in other contexts). This semi-sedentarism was no doubt favored by the wealth of natural resources available in the Mersey estuary back in the day.

The acidity of the soil did not allow bones to survive but marks in the soil did, as well as some charcoal, which provided the date: c. 5800 BCE. Nearby Formby Beach (pictured) did also provide previously scores of human footprints, as well as animal tracks. 

The chert must have been imported from nearby Wales.

December 5, 2012

Mitochondrial haplogroups M1 and U6

A new study has been published on the two most relevant African matrilineages of Eurasian origin: M1 and U6. There are others but these two are the ones, together with X1 maybe, who have a more typically African distribution with limited presence in Eurasia.

Erwan Pennarun et al., Divorcing the Late Upper Palaeolithic demographic histories of mtDNA haplogroups M1 and U6 in Africa. BMC Evolutionary Biology, 2012. Open accessLINK [doi:10.1186/1471-2148-12-234]

I must say that I am rather unpersuaded of what the authors have to say, very especially in regards to U6 (but not either on M1) but it is still a study with interesting data for the record.

Very briefly the authors use molecular-clock-o-logy (academic pseudoscience when used as alleged evidence of anything, being as it is mostly speculation with a mathematical pretext), along with very debatable archaeological interpretations, to propose that the expansion of U6 and M1 originate in the mid to late Upper Paleolithic and not, as Olivieri proposed in 2006 (and I rather support) from around the time of the (re-)colonization of West Eurasia c. 50-30 Ka ago.

Whatever the case they leave us with some data on these two lineages and some of their main subclades (not all). These can be found in table 1 and the supplementary materials. 

They also provided us with these frequency maps (enriched with approx. linguistic boundaries):

Absolute frequency of (A) M1 and (B) U6 (and approx. linguistic family boundaries)

Dabban industries

One of the contention points is the Dabban industries of Cyrenaica, which have been argued to be Aurignacoid and therefore correspond to the Homo sapiens (back-)migration into West Asia, Europe and probably also North Africa. The authors cite some references to question that the Dabban are derived from Palestinian technologies but I can only imagine (without getting into the matter in depth as of now) that the issue is under debate (as happens with other technologies from Europe, etc.)

A bigger problem is that no Dabban nor related industries are known to have existed in NW Africa, which is the region where U6 has its greatest basal diversity (clearly) and one of a few regions with greatest M1 basal diversity (the other two being Egypt and Arabia). 


U6 from NW Africa or what?

This is another element of the paper that irks me: that the authors happily reject the weight of basal diversity, which is clearly in NW Africa (Morocco notably) and around it (Canary Islands, Iberia). Yet the authors contend:

Whilst several U6 sub-clades seem to be confined to Northwest Africa, this pattern may be the result of drift and founder effects over many thousands of years and does not necessarily suggest that Northwest Africa was the geographic source of U6 dispersals in Africa.

The reasoning is simply not sound, contradicting the logic of greatest parsimony. What they say might hypothetically have happened but has a low chance, notably in absence of any other evidence.

Also the authors argue, based mostly on their own age estimates (which, I insist, are speculations, educated guesses, and cannot ever be used as evidence) that U6 may have arrived with Oranian (aka Iberomaurusian), of quite likely Gravetto-Solutrean South Iberian relatedness. This Western European connection is not only supported by some quite reasonable typological likenesses and mutual influences (back-tipping weapon points in Iberia may have an Aterian origin for example) and chronology of the sites (generally older towards the West) but also by anthropometric considerations (many of the best known Crô-Magnon type specimens, related to Gravettian industry in Europe, are North African Oranian) but also the fact that North Africa has loads of mtDNA of likely West European origin¹ (H1, H3, H4, H7 and V, amounting together to some 30% of the lineages of the region) and that Oranian ancient mtDNA was found to be consistent with this kind of mtDNA pool by Kefi in 2005² (however, as only HVS-I was tested for, the certainty is not 100% - but not your usual African L(xM,N) in any case).

So even if U6 would be of Oranian origin, it would still most likely have coalesced in Morocco (or somewhere nearby), something the authors seem reluctant to admit without offering any clear alternative.


And M1?

M1 has three regions of high basal diversity (only two subclades exist however M1a and M1b, making this kind of evaluation a bit less certain); they are: Arabia, Egypt and NW Africa.

The closest relative of this haplogroup is M20'51, which is found in SE Asia (Vietnam, South China, Indonesia, etc.) as well as Nepal. I do use this kind of "sister" references also to estimate the most likely origin jointly with basal diversity, and, in this case it suggests that M1 is from Arabia and that North African (and also East African and Highland West Asian) M1 is derived from this origin.

The authors don't seem to take a clear stand in this case either and they even do not mention the East Asian relative, insisting on analyzing only their molecular-clock-o-logic speculations, what are at best only marginally relevant.

However the concede that M1 and U6 were in Africa long before the Afroasiatic expansion.


In brief

In the end a somewhat messy study with too much emphasis in the wrong stuff but still good for the data. Check, please table 1 and, if you feel like researching the matter in greater depth the supplemental materials, which are no doubt informative in their own right.


________________________________________________________________________

¹ See these papers:
  • H. Enafaa, V. M. Cabrera et al., Mitochondrial DNA haplogroup H structure in North Africa. BMC Genetics 2009. Open Access. [LINK]
  • L. Cherni et al., Post-last glacial maximum expansion from Iberia to North Africa revealed by fine characterization of mtDNA H haplogroup in Tunisia. American Journal of Physical Anthropology. Pay per view. [LINK]
  • Claudio Ottoni et al., Mitochondrial Haplogroup H1 in North Africa: An Early Holocene Arrival from Iberia. PLoS ONE 2010. Open Access. [LINK]
² R. Kéfi et al., Diversité mitochondriale de la population de Taforalt (12.000 ans bp - maroc): une approche génétique a l’étude du peuplement de l’afrique du nord. Anthropologie 2005. [PPT presentation direct download - Institut Pasteur]

December 2, 2012

Edward Harris on the Iruña-Veleia affaire

Edward C. Harris, Director of the Bermuda Maritime Museum and world-famous among archaeologists for being the inceptor of the Harris matrix, which soon became standard procedure in all serious digs, wrote yesterday at The Royal Gazette on his recent visit to the Basque Country and the Iruña-Veleia affair. 

On this one he says the following:

In late November 2012, I was invited to the Basque Country to speak at a conference on archaeological works at the Roman town of Iruña-Veleia, a short distance from the city of Vitoria-Gasteiz, being one of the leading experts in matters of stratigraphy in archaeology, the science that controls the excavation and recording of archaeological sites, and the subsequent analyses of portable heritage from such places. While it would have been easy to bask in the honour in which the “Harris Matrix” is held in such matters, at least with the Basques, the purpose of the conference was to review some of the subjects that have made Iruña-Veleia one of the most controversial sites in the world.

The issue revolves around classes of artifacts found at the site by an archaeological team led by Idoia Filloy and Eliseo Gill, objects of pottery, brick and bone that were reused as writing tablets and inscribed with words and pictures in later Roman times. The information contained on the artifacts appears to have conflicted with presently held views of the origins of the Basque language and other subjects, so much so that some experts declared them to be fakes, forged perhaps by the archaeologists who found them. Apparently without proof, academic or otherwise, the archaeologists have been hung out to dry in the media, which unfortunately is often the fate of the falsely accused, as one Lord McAlpine found recently when he was defamed by the BBC, no less, and ‘twittered’, almost to death.

As to motivation, one cannot ‘follow the money’, as there is, and will likely always be, a dearth of it in archaeology. A preliminary audit would suggest that the archaeologists conducted the excavations to modern standards, particularly in recording, but as artifacts can be moved without losing their integrity, it is difficult to comment on the placement of objects after a “dig” has finished. 

Given the complexity of the supposedly forged graffitti, all that one can say at this stage is that if the artifacts are forgeries, that the perpetrators of such a hoax are geniuses of the first order, but who, as archaeologists, would want to claim fame on the basis of such forgeries, when the real thing is usually of a far more abiding interest?

H/t to Iruña blog.

See also for background: category: Iruña-Veleia in this blog and its ancestor.

December 1, 2012

Y-DNA from Tamils and South Indian Tribals

This is the second attempt at discussing a very interesting paper which has been hurt by an editor error in publication (a key informative element, table 2, has its columns all swapped). 

I realized that something looked quite wrong and notified the authors, who are now awaiting for PLoS to correct the problem. In the meantime they have been so kind as to provide me with a copy of the original PDF manuscript so I could properly collate the haplogroup data and share it with readers of this blog. 

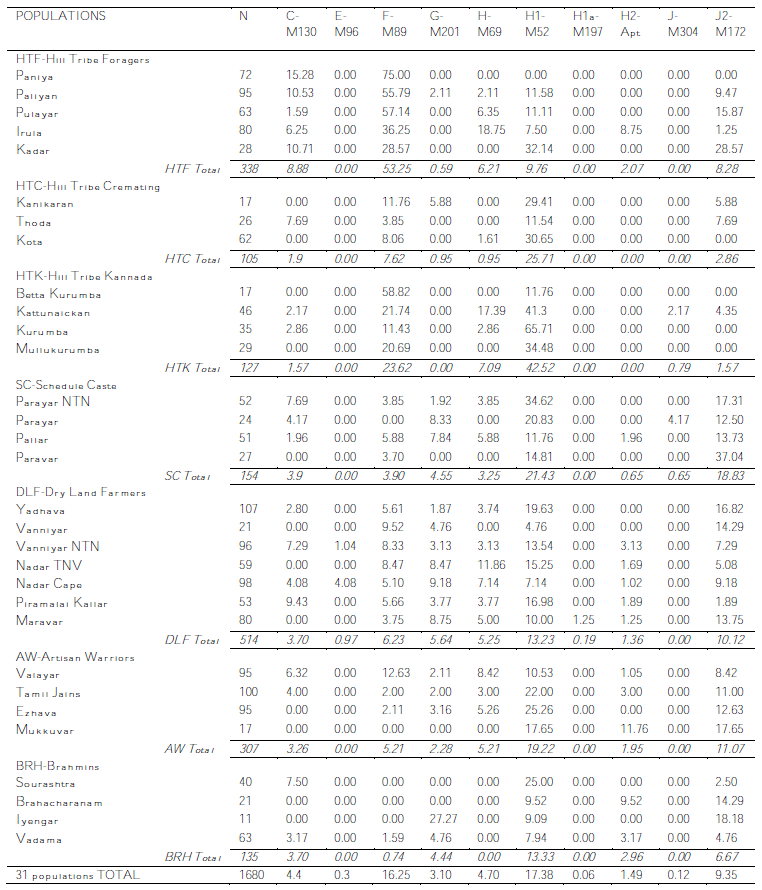
Ganesh Prasad Arun Kumar et al., Population Differentiation of Southern Indian Male Lineages Correlates with Agricultural Expansions Predating the Caste System. PLoS ONE 2012. Open accessLINK [doi:10.1371/journal.pone.0050269]

As I said back in the day:

The authors took special interest into sampling tribes, some of which are still foragers and a reference for all kind of anthropological research of South Asia, all Eurasia and even beyond. They also sorted the various populations into groups or classes based on socio-economic reality (and language in some cases) rather than the, arguably overrated, varna (caste) system.

The categories used are:
  • HTF - Hill Tribe Forager (foragers of Tamil or Malayalam language)
  • HTK - Hill Tribe Kannada (foragers of Kannada language)
  • HTC - Hill Tribe Cremation (tribals who cremate their dead, not sure if silviculturalists)
  • SC - Scheduled Castes (castes traditionally discriminated against, Dalits)
  • DLF - Dry Land Farmers 
  • AW - Artisan and Warrior related castes
  • BRH - Brahmin-related castes with irrigation farming economy

And, as I said then, the bulk of the data is in table 2, which I have the privilege of sharing with you as it really is (in two blocs, as it was in the PDF):


And now finally I can get to discuss the details with the certainty of talking about real data.


Haplogroup C


As the authors note, 90% (66/74) of all the C-M130 samples belong to C5 (M356), while the rest (8/74) tested negative for both C5 and C3 (M217), so I guess we are here before at leas one other subhaplogroup of C (because the likelihood of being Japanese C1 or Australasian C2 or C4 is practically zero).

The eight C* individuals are scattered (table S1) among several groups (all of which also display C5, as well as F*) but notably concentrated among the Piramalai Kallar (4/5 within C), which are a DLF group (corrected upon comment).

Besides C*, which may well be a remnant of either the early Eurasian expansion or of the first backflows from SE Asia (a likely not-so-likely candidate for the origin of macro-haplogroup C), the very notable presence of C5 among tribals and some farmers may well indicate that the origin of C5 is in South Asia, even if the clade also has some presence in Central and West Asia.

Haplogroup C has a high variance in this study (0.80), greatest among DLF (0.89) and HTF (0.81).

(Update: see also appendix below).

Haplogroup E


As we should expect, this lineage of African origin (with important presence in West Eurasia) is only found at low levels among farmers (DLF). It may well be a remnant of early Neolithic flows, being strongly linked with Neolithic in the case of Europe for example.


Paragroup F*


The most striking thing about Paragroup F*, i.e. F(xG,H,J,K), is that it is found at such high numbers and very especially so among the hunter-gatherers, where it is often the main lineage (or lineages). It is also important among dry land farmers and the Valayar (AW class) but it is rare to non-existent among the other caste groups, which may represent relatively recent arrivals.

Something that this confirms, along with other older data about F basal diversity, is that the main Eurasian Y-DNA haplogroup, which is of course F itself, coalesced necessarily in South Asia. 

Said that, I cannot underline enough how relevant is to find rare F sublineages (i.e. F* - so rare that have not even been properly identified by downstream markers yet) among the last forager peoples of South Asia, often as dominant clade.  

Haplotype neighbor-joining exercise was performed however, indicating founder effects (possible new haplogroups to be yet described) among tribals:

Figure 3. Reduced median network of 17 microsatellite haplotypes within haplogroup F-M89.
The network depicts clear isolated evolution among HTF populations with a few shared haplotypes between Kurumba (HTK) and Irula (HTF) populations. Circles are colored based on the 7 Major Population Groups as shown in Figure 1, and the area is proportional to the frequency of the sampled haplotypes. Branch lengths between circles are proportional to the number of mutations separating haplotypes.

However it is also obvious that there is a lot of diversity as well. In fact, paragroup F* does have a high variance in Tamil Nadu (0.81), being highest again among the DLF class (0.85).


Haplogroup G


Haplogroup G does exist in South Asia and this paper makes it evident. More so, its distribution in Tamil Nadu includes some foragers and other tribals, although it is more common among "Neolithic" classes. 

Among these the Ivayengar (BRH) show almost 27% (3/11), however other BRH populations do not show any G, while the DLF ones instead all have relevant G. Therefore this lineage may tentatively be associated in Tamil Nadu with the Neolithic.

Haplogroup G, suggested by the authors to be a Neolithic arrival, has an strikingly high variance in Tamil Nadu (0.83) with top level among the following classes: AW (1.05), SC (0.94) and BRH (0.82). 

Even if the distribution corresponds well with a Neolithic inflow the diversity is surprisingly high and it tells me that more research is needed about this lineage in South Asia. After all it is one of the basal descendants of F, whose coalescence took place no doubt in the subcontinent.


Haplogroup H


Haplgroup H is of course very common in Tamil Nadu but it must be noticed that it is concentrated in the H1(xH1a) category, as well as some notable H(xH1,H2), which tends to weight in favor of a southern ultimate origin of this important South Asian clade (as also proposed in the recent study on the Roma People). 

H* is distributed among many populations, the only class fully excluded being the BHR one, which is generally considered to be a recent historical arrival from the North (mostly confirmed by genetics). Some tribes have the highest values but then some others totally lack it. 

H* has extremely high variance levels in Tamil Nadu  (1.33), being highest among the SC class (1.46), followed by the AW one (1.18) and the DLF one (0.91). This is totally consistent with a South Asian origin of H overall.

H1* is standard issue in all populations. The highest values are among the Kannada-speaking tribals (HTK), followed by cremation-practicing tribals (HTC).

H1a instead is only found in one population at very low levels, strongly suggesting that this clade is not from the region. H2 instead is found at low levels among many groups.

Unlike H*, H1 and H2 have rather low diversity levels in Tamil Nadu: 0.41 and 0.59 respectively.


Haplogroup J 


J(xJ2) is found at anecdotal levels in a couple of lower class populations (one tribal and the other SC). It would be particularly interesting if we knew it is not J1 as well - but we don't. 

Most is J2(xJ2a) although J2a3 is also important among several populations.

It is generally believed that J in South Asia is of Neolithic origin and I will not question it but still... notice how important it is among several tribal foragers: >4% in four tribes, levels on average similar to those of farmers and Brahmins.

J2* is rather high in diversity (0.73), notably among the AW class (1.0), while J2a3 is very low instead (0.29).


Paragroup K(xL,R)


Or if you wish paragroups K* and P*, as well as haplogroups O and Q. 

The always interesting K* is found at low levels among some tribals and most DLF populations. However the peak is among Viyengar Brahmins. May it be haplogroup T?, L2?

O in this area is almost for sure O2a brought by Austroasiatic-speaking rice farming tribes in the Neolithic. It is found at low levels in some groups, including the Thoda "cremation tribals" (who look quite "Neolithic" also because of their high levels of J2).

P(xQ,R), which is most common towards Bengal, is found in Tamil Nadu at low levels among diverse populations. On first impression I'd say it's also a Neolithic influence although, of course, in the wider subcontinental region it must be much much older. 

Q is found at low levels in diverse populations being maybe somewhat more common among the Scheduled Castes class.


Haplogroup L


Haplogroup L is an important South Asian lineage with penetration in West and Central Asia and a center of gravity around Sindh (Pakistan), although it is also very common in West and South India. 

In Tamil Nadu L1a (L1 in the table) is common among nearly all sampled populations with peak among the dry land farmers' class.

Instead L1c (formerly L3) is relatively rare, peaking among the Scheduled Castes class. No mention is made of any other L.

Both clades show low variance in the region (0.41 and 0.22 respectively), consistent with their origin being further North.

Haplogroup R


R(xR1a1,R2) is found in several populations at non-negligible levels: near 5% among some tribals, 8% among the Parayar (SC) and the Maravar (DLF), also 12% Mukkuvar (AW) and as much as 19% among some Brahmins (the Brahacharanam who are also high in P*). This could well be R*, R1*, R1a*, R1b, etc. and indicates in my understanding target populations for future research on the hot topic of the ultimate origins of R1 and R1a (see also here). 

R* shows clearly high variance:  0.97 on average, being highest among the DLF class (1.25), followed by the BRH class (0.99)

R1a1, which may well be related to Indoeuropean expansion (or just Neolithic or whatever, better resolution is needed especially in Asia) is found at very high levels among the BRH class (45%), followed by the AW one (20%) other classes show near 10% except the hunter-gatherers (HTF and HTK) who have only anecdotal presence of this lineage. 

R1a1 shows rather low variance (0.41), rather confirming its immigrant origin from North India (incl. maybe Pakistan, Bangla Desh, Nepal...). All classes are similar for this value.

R2 (a South Asian lineage with occasional offshoots into West and Central Asia) is common in all groups except the HTF class. The highest levels (c. 15% avg.) are among cremating tribals and artisan/warrior classes. I'd say that with the likely origin of R2 somewhat to the North of this region, it seems normal that Kannada-speaking tribals (HTK, who must be immigrants from Karnataka or at least strongly influenced by this other Dravidian country's culture) have lots of it, while the more locally native HTF almost lack it instead.

R2 shows mid-level diversity on average (0.65) but the HTK class displays very high diversity for this lineage (1.05).


Different interpretations


Notice that my take and that of the authors on the autochthonous nature of each of the lineages may vary or be debatable. They say the following:

The geographical origins of many of these HGs are still debated. However, the associated high frequencies and haplotype variances of HGs H-M69, F*-M89, R1a1-M17, L1-M27, R2-M124 and C5-M356 within India, have been interpreted as evidence of an autochthonous origins of these lineages during late Pleistocene (10–30 Kya), while the lower frequency within the subcontinent of J2-M172, E-M96, G-M201 and L3-M357 are viewed as reflecting probable gene flow introduced from West Eurasian Holocene migrations in the last 10 Kya [6], [7], [16], [23]. Assuming these geographical origins of the HGs to be the most likely ones, the putatively autochthonous lineages accounted for 81.4±0.95% of the total genetic composition of TN populations in the present study.

Mostly our differences stem on my doubts about the real origins of R1a1 (which could well be West Asian by origin) and that I imagined L1c (aka L3) as native from South Asia (uncertain now admittedly). But otherwise I agree. The hottest issue is no doubt the origin of R1a or R1a1, still unsolved. 


PC Analysis


A quick visual understanding of the relations between the different classes can be obtained from figure 2:

Figure 2. Plots representing the genetic relationships among the 31 tribal and non-tribal populations of Tamil Nadu.
(A) PCA plot based on HG frequencies. The two dimensions display 36% of the total variance. The contribution of the first four HGs is superimposed as grey component loading vectors: the HTF populations clustered in the direction of the F-M89 vector, HTK in the H1-M52 vector, BRH in the R1a1-M17 vector, while the HG L1-M27 is less significant in discriminating populations. (B) MDS plot based on 17 microsatellite loci Rst distances. The two tribal groups (HTF and HTK) are clustered at the left side of the plot while BRH form a distant cluster at the opposite side. The colors and symbols are the same as shown in Figure 1, while population abbreviations are as shown in Table 1.

Check table 1 for population codes but essentially: squares are tribes and circles caste populations; red are the HTF class, green the HTK and yellow the Brahmin-related groups (BRH).

These are the outliers: all the rest, including HTC, cluster together near the (0,0) coordinates.

It is also clearly indicated in Fig. 2A how R1a1, H1 and F* are the strongest defining markers.


Old structure

As always, take age estimates, also provided, with utmost caution and distrust. However I must mention that the main conclusion of the authors is that the haplogroup structure in the region pre-dates the introduction of the caste system as such and is, in their opinion, of Neolithic age.


 __________________________ . __________________________

Appendix (update Dec 2):


Much of the discussion below has been on the origins of haplogroup C. I have been pointed to Hammer 2006 and this haplotype NJ tree (fig 4d) of what was known back in the day as C* and C1. At that time neither Australian C4 nor Asian C5 had been described yet. However Wallacean/Melanesian/Polynesian C2 and NE Asian and Native American C3 are not shown here.

Annotations (C1, C4 and root?) by me:


Maybe even more interesting is Fig. 3 from Redd 2002, which shows the whole C haplogroup tree and clearly annotates the likely root (branch to haplogroup B):


While C4 is not obvious here, the fact that South Asian (Indian subcontinent) C* is central to all the haplogroup is again underlined.

The protuberance to the top might be C5, while the one to the bottom may well correspond with the SE Asian cluster above, at least partly. The differences underline the limitations of this STR-based method alone to infer real phylogenies - but it is anyhow much better than nothing.

November 30, 2012

Ice and "complex organic materials" on Mercury's poles

This is one of those perplexing astronomical news that make history and I can't but mention. US scientists have found, with the help of scout satellite MESSENGER,  that not just suspected Mercury's polar water ice (in shadowed craters) is indeed that but also that confusing dark regions around it are complex organic materials, possibly darkened by the intense solar radiation that bathes the small inner planet. 

The team found that the probe's reflectance measurements, taken via laser altimetry, matched up well with previously mapped radar-bright regions in Mercury's high northern latitudes. Two craters in particular were bright, both in radar and at laser wavelengths, indicating the possible presence of reflective ice. However, just south of these craters, others appeared dark with laser altimetry, but bright in radar.

This confused scientists for a while but eventually they realized that the puzzling regions actually hold water ice at a meter's depth into the soil, where the heat of the sun can't reach so easily. 

Radar-reflectant regions (ice) show in yellow

The most interesting part however is that the astronomers are almost certain now that the dark material must be complex organic matter, darkened by the extreme solar radiation.

Is there life in Mercury? 


Source: Science Daily.

Ref studies: 
  1. David A. Paige, Matthew A. Siegler, John K. Harmon, Gregory A. Neumann, Erwan M. Mazarico, David E. Smith, Maria T. Zuber, Ellen Harju, Mona L. Delitsky, and Sean C. Solomon. Thermal Stability of Volatiles in the North Polar Region of Mercury. Science, 29 November 2012 DOI: 10.1126/science.1231106
  2. Gregory A. Neumann, John F. Cavanaugh, Xiaoli Sun, Erwan M. Mazarico, David E. Smith, Maria T. Zuber, Dandan Mao, David A. Paige, Sean C. Solomon, Carolyn M. Ernst, and Olivier S. Barnouin. Bright and Dark Polar Deposits on Mercury: Evidence for Surface Volatiles. Science, 29 November 2012 DOI: 10.1126/science.1229764

November 29, 2012

Asturian internal genetic barriers for both uniparental markers (revised)

¡Bumped because of correction and updates that markedly change the original!


Formal correction (Nov 29):

All what I said about not testing for G2a seems incorrect because one individual with this lineage was reported in the Oviedo district. This leaves 21 F(xG2a,K) individuals (15 of them from the Avilés district, making 20% of the local gene pool) in the mystery zone. They could still be other G subclades (but rare in Iberia or elsewhere in Europe), H (but normally thought as restricted to Roma People in Europe) or F* (F-other). 

Some rare F clades have been reported in Europe before but never in such large numbers, I believe. Sadly the authors mention for comparison old (2004-06) studies of the Caucasus, etc. which appear not to have tested for G, leading me to think (with the help of awfully presented, or rather hidden, raw data) that they had not tested for G2a. 

The seem to have done it after all. Thanks for noticing to Jean.

Follows original entry and update (bottom) with haplogroup frequencies (based on the work of Jean Lohizun, who sorted up the raw lists into something you can at least count).

_____________________________ . . . _____________________________

Original entry (Nov 28):


This new paper on the genetics of Asturias (Iberia) seems to be of limited interest because the authors only appear interested in statistical inference, instead of properly reporting basic data as primary social service of their publicly paid research effort. They also seem dead set into not testing for well known Iberian lineages like Y-DNA G2a (or even G, never mind discerning subclades of E) something that was already obvious in their previous attempt with mtDNA, and seem oblivious to some of the most important work on the population (haploid) genetics of the Iberian Peninsula such as Adams 2008.

Still it may be of interest for data miners but be warned that all the haplogroup data is only available as long unsorted PDF lists in the supplemental material (mtDNA list download, Y-DNA list download).

Antonio F. Pardiñas et al., Assessing the Genetic Influence of Ancient Sociopolitical Structure: Micro-differentiation Patterns in the Population of Asturias (Northern Spain). PLoS ONE 2012. Open access → LINK [doi:10.1371/journal.pone.0050206]

Maybe the only highlight of the study is that the authors infer some genetic barriers within Asturias, especially segregated seem to be the coastal district of Avilés (3) and the mountain miner districts so-called Southern Oviedo and Caudal (5, 9), also including the Narcea (2) district for matrilineages (mtDNA). Meanwhile the largely Galician-speaking Eastern district of Eo-Navia (1) appears segregated only for patrilineages (Y-DNA). 

Figure 2. Map of Asturias showing the SAMOVA group division coupled with the inferred barriers to gene flow.
Panels show results for the mtDNA data (A) and NRY data (B). Thin lines indicate division in the SAMOVA analysis but no actual barrier inference, while inferred barriers between groups are shown by strong lines. Bootstrap value for each of the barriers is shown next to it and only those with values equal or higher than 70 are shown.

The authors find hard to understand the genetic distinctiveness of Avilés district and talk wildly about "basal F" (probably G2a but why did not you test for that?!) Haplogroup G is relatively rare in Asturias but common for example in Portugal or Ibiza, being surely an indicator of Neolithic-derived settlement (found in ancient DNA from Occitan and Catalan Cardium Pottery sites and is also the lineage of the famous Alpine mummy Ötzi, probably also of Cardial ancestry). However, as you may know, no Cardium pottery is known so far to the North or West, so it may indicate a post-Neolithic resettlement of some sort. 

The paper also provides some PC analysis in relation to Europe but fails to explain properly which are each of the various Asturian "groups" (which seem to correspond to clusters by thin lines in the map above - maybe digging in the supp. material... but worth it?)

Figure 3. PCA plot of mtDNA haplogroups of Asturias and other regions of Iberia, the British Isles and Mainland Europe.

Figure 4. PCA plot of NRY haplogroups of Asturias and other regions of Iberia, the British Isles and Mainland Europe.

En fin: a confusing paper that could have been much better or at least user-friendly with some little extra effort and better focus. Still worth mentioning, I guess. 

See also: Asturian mtDNA (on a previous paper by the same team) and category: Iberia


 ______________________ ... ______________________

Update (Nov 29): haplogroup count

Based on lists made by Jean Lohizun.

Y-DNA:
  • E: 22
  • F*: 21
  • G2a: 1
  • I: 5
  • J: 12
  • K*: 9
  • R*: 8
  • R1b1a2: 106

Mitochondrial DNA:
  • HV*: 2
    • HV0*: 9
      • V: 5
    • (within HV4):
      • HV4a*: 5 
        • HV4a1a: 3
      • HV4b: 2
    • HV6: 1
    • HV12b: 13
    • H*: 12
      • H1*: 1
        • H1a*: 1
          • H1a3: 4
        • H1b: 1
        • H1c*: 6
          • H1c3: 3
        • H1f: 2
        • H1h: 4
        • H1j: 3
        • H1x: 1
      • H2a2*: 50
        • H2a2b: 4
          • H2a2b1: 9
        • H2a5b: 1
      • (within H3d):
        • H3d: 6
        • H3f: 6
        • H3g: 12
        • H3h: 3
      • H5: 13
      • H6*: 10
        • H6a1a1a: 1
      • H7a1: 1
      • H9a: 1
      • H10a1: 4
      • H15: 3
      • H20: 1
  • JT*: 1
    • (within J):
      • J1*: 1
        • J1b1a1: 7
        • J1c*: 4
          • J1c1: 5
          • J1c2: 12
      • (within J2):
        • J2a1a: 1
        • J2a2: 1
        • J2b1a: 5
    • T*: 3
      • T1: 1
        • T1a: 9
          • T1a2a: 1
      • T2*: 2
        • T2b*: 16
          • T2b3*: 2
            • T2b3a: 1
        • T2c*: 2
          • T2c1b: 1
        • T2e*: 2
          • T2e1: 4
  • (within U):
    • U1a2: 1
    • U4*: 2
      • U4a1*:2
        • U4a1d: 3
      • U4a3: 1
      • U4b3: 1
    • (within U5):
      • U5a1*: 4
        • U5a1a1: 1
        • U5a1b1*: 1
          • U5a1b1e: 1
      • U5a2: 2 
      • U5b*: 1
        • U5b1b1*: 1
          • U5b1b1e: 1
        • U5b1d: 5
        • U5b1f: 2
        • U5b1g: 1
        • U5b2a1a: 1
        • U5b2a1b: 1
    • U6*: 2
      • U6a:1
    • (within U8):
      • U8a: 1
      • K*: 1
        • K1*: 1
          • K1a*: 2
            • K1a1: 1
            • K1a3a: 3
            • K1a4c: 6
            • K1b1a2: 2
        • K2*: 1
          • K2a: 1
  • R9*: 1
    • R9b2: 1
  • (within N1):
    • I*: 1
      • I1a1: 1
      • I2a: 1
    • N1b: 1
    • N1e'l*: 1
  • W*: 1
    • W1: 1
  • (within X2):
    • X2b: 1
    • X2d: 1
  • (within M):
    • D4k: 1
    • M1*: 1
      • M1b1a: 1
  • (within L3(xM,N)):
    • L3f1b4a: 5
    • L3x: 1
  • L2a: 1
  • L1b: 1