Showing posts with label molecular clock. Show all posts

June 29, 2014

Pan-Homo split: 11-17 million years ago

Chimpanzee mutation rate is largely determined by fathers' age and, overall, implies a Pan-Homo divergence rate of ~13 million years (95% CI: 11-17 Ma), about double than usually assumed by conservative scholastic inertia.

Oliver Venn et al., Strong male bias drives germline mutation in chimpanzees. Science 2014. Pay per viewLINK [doi:10.1126/science.344.6189.1272]

cc Matthew Hoelscher
The focus of this study are the important differences between patrilineal and matrilineal mutation rate depending on the father's age among chimpanzees, notably more biased than among humans. However the resulting estimate for Pan-Homo divergence is not less important because it radically challenges the usual assumptions of 5-7 Ma, repeated once and again in molecular clock estimates, which are based on studies that are already quite obsolete.

In the studied captive population of Western chimpanzees 30 out of 35 mutations happened in the paternal lineage, and these increase with the father's age. No effect could be attributed to maternal age or familiar peculiarities.

Interestingly most of these patrilineal mutations happen near the telomeres, an effect not seen in female line mutations.

Owing to this gender bias, the mutation rate of the X chromosome among chimpanzees is 74% that of autosomal DNA (in humans: 85%). 

The gender bias in mutation rate and its differential with humans is attributed to differences in mating systems among great apes, with chimpanzees having the greatest competition among males, what is reflected in testicle size. They predict that gorillas (who experience less competition between males) will show less patrilineal mutation rate bias than humans and chimpanzees.

This is probably the more synthetic paragraph from the study:
Under a model in which the mutation rate increases linearly with parental age, the rate of neutral substitution is the ratio of the average number of mutations inherited per generation to the average parental age. We predict the neutral substitution rate to be ~0.46 × 10⁻⁹ per base pair (bp) per year in chimpanzees, compared to estimates in humans of ~0.51 × 10⁻⁹ bp−1 year−1 (9). These results are consistent with near-identical levels of lineage-specific sequence divergence (12) but surprising given the differences in paternal age effect. In the intersection of the autosomal genome accessible in this study and regions where human and chimpanzee genomes can be aligned with high confidence, the rate is slightly lower (0.45 × 10⁻⁹ bp−1 year−1) and the level of divergence is 1.2% (13), implying an average time to the most common ancestor of 13 million years, assuming uniformity of the mutation rate over this time (95% ETPI 11 to 17 million years; table S11).


13 million years of the hominid line

This is not at all the first study to highlight the extreme dubiousness of the usual scholastic assumptions regarding the Pan-Homo divergence, which taint so many genetic studies, turning their chronological estimates totally worthless.

In 2010, Wilkinson et al. estimated a Pan-Homo divergence rate of 8-10 Ma. In 2012 Langergraber et al. recalibrated previous studies getting a Pan-Homo divergence bracket of 6.78-13.45 Ma (fig.2), while the divergence from Gorilla would be significantly older: 8.31-20.0.

Fig. 1 from Langergraber 2012. Legend: Diagram illustrating the branching pattern and timing of the splits between humans, chimpanzees, bonobos, western gorillas, and eastern gorillas. The paler shading indicates the range of split times inferred in this study. Cartoon skulls indicate approximate age of the indicated fossil remains, but do not imply that these fossils were necessarily on those ancestral lineages or that entire crania actually exist for these forms.


A key fossil affecting this controversy is Sahelanthropus tchadiensis (Toumaï), which has been recently confirmed to be in the human line on several hardly questionable traits and is dated to c. 7 Ma.

A related debate is whether primates in general are much older than usually claimed and lived already in the Jurassic, something suggested by the already mentioned Wilkinson study and also by Heads 2010. Here a major issue is that mainline conservative estimates would have the ancestors of New World monkeys swimming (island hoping) to South America, something that those monkeys (and most other primates) simply will not do. The radiation of primates to South America and possibly also Madagascar is much better explained if these animals could just tree-hop, rather than island-hop to their destinations. However this would demand a radical revision of the usual age estimate for vertebrate radiation, what so far lacks fossil support (but lack of evidence is not evidence of lack, you know: fossil ages can only be taken as terminus ante quem dates and not absolute direct references).

But this is a side question, what really matters to us is that our ancestors split from the chimpanzee line c. 13 Ma (according to this study) and not after 8 Ma in any case (weighting all the evidence). This not just renders most "molecular clock" estimates useless and effectively false (wrong, erroneous, inadequate, misleading, junk, pseudoscientific...) but also help us to rethink our ancestral history in the African savannas since long before we became humans (Homo sp.)

Looking for some ecological context clues, I found this 1996 study by Jean Maley, which shows that Africa was largely humid in the early Miocene (smectite: evidence of water) but that it became increasingly arid towards the middle Miocene (kaolinite: evidence of sand). Up to this key ecological change of the Middle Miocene, the rainforest extended all the way to Egypt and East Africa. This kind of ecology allows for the common ancestor of African great apes to have arrived and first diverged in a jungle-dominated ecology and, later, for the speciation event leading to humans (bipedalism) to have happened as this once widespread jungle became scarcer, yielding to deserts and savanna.

Sahelanthropus (from fossilized.org)
It just makes all sense that the evolution of bipedalism was coincident with the vanishing of that originally widespread jungle environment whose dating is of approx. 13 Ma ago. However it must be said that the consolidation of the Sahara only happened much later, c. 7 Ma ago, already approaching the Pliocene.

Regardless of the exact split-time, a big question I have on hominid evolution is how on Earth did our small-brained and small-toothed precursors like Toumaï survive in the open savannas and grasslands without fire nor weapons. Even if they resorted to trees (isolated or in patches) for refuge, there were already felines of the saber-toothed family roaming in Africa and these big cats were no doubt be able  to climb on trees and in some cases they have been shown to predate on australopithecines. How could our precursors in the hominin line be able to face this menace without the advantage of speed (as ruminants have) or good defenses? Were their strong forelimbs, together with team action enough to confront the threat of predators? Did they use primitive weapons such as branches and stone throwing?

June 21, 2014

Claim of 13 Ma Pan-Homo split

[Update (Jun 29): new entry on this issue available].

[Update: the origin of this news is Venn 2014 but I could not find the mention of the 13 Ma split initially, as it was not something they underlined at all. I will write something as soon as possible. Thanks to all the people who helped my confused mind].

Live Science reports this week that the divergence of the human and chimpanzee lines may be as old as 13 million years. This is the oldest range of what Langergraber 2012 suggested (8-13 Ma in Fig.1, although in text they wrote "6.8-11.6 Ma") and older than the Wilkinson 2010 estimates (8-10 Ma), and would totally break all the usual "molecular clocks" so extremely abused in human genetics because it is double of the usual scholastic mindless parroting (5-7 Ma, which are necessarily too recent because they do not allow for Sahelanthropus' evolution and not even for bonobo evolution under the protection of the mighty Congo river).

Sadly the article includes no reference to the source, not even the name of the scientists involved, and I could not find it any reference online. For a moment I thought it could be another new study on gender bias in chimpanzee mutation rate (Venn et al. 2014 (ppv)) but after getting a copy it does not seem to have any direct relation.

So I would appreciate if someone can give me a lead on where this claim may come from.

May 24, 2014

A genetic legacy of North Africa: mtDNA U6 under the microscope

An excellent new study on mtDNA haplogroup U6 has been published this week:

Bernard Sechel et al., The history of the North African mitochondrial DNA haplogroup U6 gene flow into the African, Eurasian and American continents. BMC Evolutionary Biology 2014. Open accessLINK [doi:10.1186/1471-2148-14-109]
Abstract (provisional)

Background

Complete mitochondrial DNA (mtDNA) genome analyses have greatly improved the phylogeny and phylogeography of human mtDNA. Human mitochondrial DNA haplogroup U6 has been considered as a molecular signal of a Paleolithic return to North Africa of modern humans from southwestern Asia.

Results

Using 230 complete sequences we have refined the U6 phylogeny, and improved the phylogeographic information by the analysis of 761 partial sequences. This approach provides chronological limits for its arrival to Africa, followed by its spreads there according to climatic fluctuations, and its secondary prehistoric and historic migrations out of Africa colonizing Europe, the Canary Islands and the American Continent.

Conclusions

The U6 expansions and contractions inside Africa faithfully reflect the climatic fluctuations that occurred in this Continent affecting also the Canary Islands. Mediterranean contacts drove these lineages to Europe, at least since the Neolithic. In turn, the European colonization brought different U6 lineages throughout the American Continent leaving the specific sign of the colonizers origin.

Figure 1 Surface maps, based on HVI frequencies (in o/oo), for total U6 (U6), total U6a
(Tot U6a), U6a without 16189 (U6a), U6a with 16189 (U6a-189), U6b'd, U6c, U6b and U6d.
U6 can be considered a somewhat strange haplogroup. While it is derived from U (and hence from R and N), which has an Asian origin, it seems to have expanded from NW Africa, more specifically from the Northern mountainous areas of the Moroccan state, a country known as Rif or in the native Tamazigh language Arif (of which Rif is an Arabized version), not the usual place one tends to imagine as the origin of any human expansion wave. 

Actually there is at least one important cultural expansion from that area: the Oranian or Iberomaurusian culture of the Mid-to-Late Upper Paleolithic. To some extent at least the expansion of this lineage is probably associated to this ancient culture. 

Whatever the case, U6 is not a common haplogroup: its highest peak in frequency is in the Canary Islands (16%), followed by North-West Africa (5-9%). Then come Portugal and its insular colonies, as well as Cape Verde and Ethiopia (~3%) and then there is some scatter in Spain, West Africa, NE Africa and peninsular Arabia (~1%), as well as in some other parts of Europe, Africa and West Asia (<1%). 

On the other hand it is one of the four basal branches of the major West Eurasian haplogroup U (U5 and U2'3'4'7'8'9 are more common, while U1 is even rarer and less studied), so understanding U6 seems important to better understand its parent lineage. 

Therefore this new study with its great wealth of detail and care is much welcome.


Chronological estimates and expansion patterns of U6

It may surprise you that I am even in tentative agreement with the chronological estimates for U6 and its subclades, listed in tables 2 and 3. But it is for a good reason: they make sense (assuming a reasonable CI). And the fact that they seem to make sense is probably because the authors took great care to calibrate the ages for this lineage, using as main (but not only) reference a Canadian derived lineage that seems to be a colonial founder effect. 

Anyhow all these dates should be considered as center-points of a variably wider range of possibilities, the so-called confidence interval (CI) or error margin (em). If we do that, as we should, we get the "power" to stretch the figures forth and back as need be to some extent without losing consistency, and that alone should be enough to get the estimates fit better with the material evidence (archaeology mostly). 

The authors actually mention some of those CIs in a lengthy section dedicated to explore the possible patterns of U6 spread in Africa and elsewhere.

Interestingly they suggest that the first radiation of U6 took place from NW Africa in largely eastwards direction, belonging almost necessarily to the Iberomaurusian (Oranian) culture:
This first African expansion of U6a in the Maghreb was suggested in a previous analysis [6]. This radiation inside Africa occurred in Morocco around 26 kya (Table 2) and, ruling out the earlier Aterian, we suggested the Iberomaurusian as the most probable archaeological and anthropological correlate of this spread in the Maghreb [6]. Others have pointed to the Dabban industry in North Africa and its supposed source in the Levant, the Ahmarian, as the archaeological footprints of U6 coming back to Africa [7,9]. However, we disagree for several reasons: firstly, they most probably evolved in situ from previous cultures, not being intrusive in their respective areas [42-44]; second, their chronologies are out of phase with U6 and third, Dabban is a local industry in Cyrenaica not showing the whole coastal expansion of U6. In addition, recent archaeological evidence, based on securely dated layers, also points to the Maghreb as the place with the oldest implantation of the Iberomaurusian culture [45], which is coincidental with the U6 radiation from this region proposed in this and previous studies [6].

Some millennia later, U62 appears to expand in Ethiopia, while, as mentioned, U6a1 does the same in Europe (mostly Western Iberia) and other sister lineages do the same in NW Africa itself.

A second wave of radiation corresponds to the early Holocene:
Basic clusters like U6b, U6c and U6d also emerged within a window between 13 to 10 kya (Table 2). U6b lineages spread from the Maghreb, through the Sahel, to West Africa and the Canary Islands (U6b1a), and are also present from the Sudan to Arabia, but not detected in Ethiopia. In contrast, U6c and U6d are more localized in the Maghreb. Further spreads of secondary U6a branches are also apparent, going southwards to Sahel countries and  reaching West Africa (U6a5a). Autochthonous clusters in sub-Saharan Africa first appeared at around 7 kya (U6a5b), coinciding with a period of gradual desiccation that would have obliged pastoralists to abandon many desert areas [52]. Consequently, no more U6 lineages in the Sahel are detected, while later expansions continued in West Africa (U6a3f, U6a3c, and U6b3) and the Maghreb with an additional spread to the Mediterranean shores of Europe involving U6b2, U6a3e, U6a1b and U6a3b1.

For easier understanding of the U6 phylogeny and its sometimes hard to interpret migration patterns, I made up the following graph, based on the supplemental material of this study:

U6 phylogeny, color coded by regions:
  • North Africa
  • Europe
  • Tropical Africa
  • West Asia
  • intermediate colors: equal weight between two regions, black: undecided
  • italic type: unnamed lineages
I must say that, I have some doubts about the exact origins of several subhaplogroups, notably:
  • U6a is so diverse in some branches that it is difficult to identify it as unmistakably of NW African origin. NW Africa still gets the greatest weight (3/7) but not a clear majority.
  • In U6b Tropical African lineages weight 4.5/10, while NW African ones weight only 3/10. It is a good candidate for expansion from the "Wet Sahara" indeed.
  • In U6c1 European and NW African lineages weight exactly the same, although I guess that it may be reasonable to imagine Andalusian U6c1c as derived from North Africa.
However overall U6, as well as its derived lineages U6b'd and U6c clearly originated in NW Africa, so I understand that, when unclear, NW Africa gets the benefit of doubt for the derived origins.

May 22, 2014

Autosomal modeling getting closer to archaeological facts by doubling effective mutation rate

Interesting try at autosomal DNA nuclear clock-o-logy. Not quite it yet but interesting nevertheless because it approximates much better what seems to be the reality, based on archaeological data, than previous attempts.

Stephan Schiffels & Richard Durbin, Inferring human population size and separation history from multiple genome sequences. Pre-published at bioRxiv, 2014. Freely accessibleLINK [doi:http://dx.doi.org/10.1101/005348]
Abstract

The availability of complete human genome sequences from populations across the world has given rise to new population genetic inference methods that explicitly model their ancestral relationship under recombination and mutation. So far, application of these methods to evolutionary history more recent than 20-30 thousand years ago and to population separations has been limited. Here we present a new method that overcomes these shortcomings. The Multiple Sequentially Markovian Coalescent (MSMC) analyses the observed pattern of mutations in multiple individuals, focusing on the first coalescence between any two individuals. Results from applying MSMC to genome sequences from nine populations across the world suggest that the genetic separation of non-African ancestors from African Yoruban ancestors started long before 50,000 years ago, and give information about human population history as recently as 2,000 years ago, including the bottleneck in the peopling of the Americas, and separations within Africa, East Asia and Europe.

Based on Figure 4c:

Figure 4: Genetic Separation between population pairs
(...) (c) Comparison of the African/Non-African split with simulations of clean splits. We simulated three scenarios, at split times 50kya, 100kya and 150kya. The comparison demonstrates that the history of relative cross coalescence rate between African and Non-African ancestors is incompatible with a clean split model, and suggests it progressively decreased from beyond 150kya to approximately 50kya. (...)

This comparison reveals that no clean split can explain the inferred progressive decline of relative cross coalescence rate. In particular, the early beginning of the drop would be consistent with an initial formation of distinct populations prior to 150kya, while the late end of the decline would be consistent with a final split around 50kya. This suggests a long period of partial divergence with ongoing genetic exchange between Yoruban and Non-African ancestors that began beyond 150kya, with population structure within Africa, and lasted for over 100,000 years, with a median point around 60-80kya at which time there was still substantial genetic exchange, with half the coalescences between populations and half within (see Discussion). We also observe that the rate of genetic divergence is not uniform but can be roughly divided into two phases. First, up until about 100kya, the two populations separated more slowly, while after 100kya genetic exchange dropped faster. We note that the fact that the relative cross coalescence rate has not reached one even around 200kya (Figure 4c) may possibly be due to later admixture from archaic populations such as Neanderthals into the ancestors of CEU after their split from YRI [29].

Follows their population size estimates:

Figure 3: Population Size Inference from whole genome sequences
(a) Population size estimates from four haplotypes (two phased individuals) from each of 9 populations. The dashed line was generated from a reduced data set of only the Native American components of the MXL genomes. Estimates from two haplotypes for CEU and YRI are shown for comparison as dotted lines.
(...)

A serious problem I have with this graph is that the gradual bottleneck affecting Eurasian-plus populations does not begin to recover within this simulation before c. 40 Ka. That doesn't seem good enough because by that time the Asian population must have expanded at least moderately, as they had colonized all the continent and even Australasia by that date. 

This means that there is a lot of refining still to be done to the methodology, because there should be signal of expansion in Asia much earlier than 40 Ka and not more and more apparent decrease of the population size, what is totally inconsistent with the ongoing colonization of a whole continent. 

I could try to double again the rates to get a more consistent Asian expansion age of c. 80 Ka but that should push the Eurasian-plus bottleneck to a much earlier date, 600 Ka ago, what is simply nonsensical. So the only possible conclusion is that the algorithm is far from realistic and still needs a lot of work.
Non-Bantu East Africans belong to the proto-Eurasian cluster:
Our results suggest that Maasai ancestors were well mixing with Non-African ancestors until about 80kya, much later than the YRI [Yoruba]/Non-African separation. This is consistent with a model where Maasai ancestors and Non-African ancestors formed sister groups, which together separated from West African ancestors and stayed well mixing until much closer to the actual out-of-Africa migration.

South Asians exchanged a lot with West Eurasians before Neolithic:
.... the GIH [Gujarati emigrants to Texas] ancestors remained in close contact with CEU [NW European emigrants to Utah] ancestors until about 10kya, but received some historic admixture component from East Asian populations, part of which is old enough to have occurred before the split of MXL.
Figure 4: Genetic Separation between population pairs
(...) (d) Schematic representation of population separations. Timings of splits, population separations, gene flow and bottlenecks are schematically shown along a logarithmic axis of time. (...)

Overall their population tree makes good sense, except for the apparently too recent dates for nearly all the events and very especially for the intra-Eurasian split. There are no doubt confounding factors acting here. Probably if MXL (Native American component) were excluded, the West-East split could be moved backwards in time.

They heavily rely on the MXL Native American element to calibrate the clock, what makes sense on the surface. But  the fact that Native American origins are themselves a mix of West/South Eurasian and East Asian origins may be tricking them. In the tree, MXL derives from East Asians and it actually should be, we know for a fact, intermediate between East Asia and West/South Eurasia, something that is not reflected at all and that is almost certainly altering the picture.

But, as said above, there are more corners, some quite prominent, to be polished in all the modeling process until a future version of it can be acknowledged as a reliable "clock" (emphasis on reliable, because some people put way too much faith on these rough approximations, what is clearly an error).

On mutation rates:
Our results are scaled to real times using a mutation rate of 1.25×10⁻⁸ per nucleotide per generation, as proposed recently [16] and supported by several direct mutation studies [14-16]. Using a value of 2.5×10⁻⁸ as was common previously [44, 45] would halve the times. This would bring the midpoint of the out-of-Africa separation to an uncomfortably recent 30-40kya, but more concerningly it would bring the separation of Native American ancestors (MXL) from East-Asian populations to 5-10kya, inconsistent with the paleontological record [25, 26].

In short: using the usual scholastic mutation rates would have been nonsensical. Doubling them was common sense needed to achieve minimal coherence with observed reality (how many times have I said that?) It is obviously not enough but it was something needed in any case.

March 29, 2014

Y-DNA R1a spread from Iran

While this conclusion was something more or less reachable with previous data (see HERE for example), a new study adds some fine detail for us to reconstruct the paleohistory of this major Eurasian lineage.

Peter A. Underhill et al., The phylogenetic and geographic structure of Y-chromosome haplogroup R1a. EJHG 2014. Pay per viewLINK [doi:10.1038/ejhg.2014.50]

Important: supplemental materials are freely available.

Abstract

R1a-M420 is one of the most widely spread Y-chromosome haplogroups; however, its substructure within Europe and Asia has remained poorly characterized. Using a panel of 16 244 male subjects from 126 populations sampled across Eurasia, we identified 2923 R1a-M420 Y-chromosomes and analyzed them to a highly granular phylogeographic resolution. Whole Y-chromosome sequence analysis of eight R1a and five R1b individuals suggests a divergence time of ~25 000 (95% CI: 21 300–29 000) years ago and a coalescence time within R1a-M417 of ~5800 (95% CI: 4800–6800) years. The spatial frequency distributions of R1a sub-haplogroups conclusively indicate two major groups, one found primarily in Europe and the other confined to Central and South Asia. Beyond the major European versus Asian dichotomy, we describe several younger sub-haplogroups. Based on spatial distributions and diversity patterns within the R1a-M420 clade, particularly rare basal branches detected primarily within Iran and eastern Turkey, we conclude that the initial episodes of haplogroup R1a diversification likely occurred in the vicinity of present-day Iran.

This case, as well as many others, including that of its close relatives R1b and Q, illustrate why frequency is not the same as origin, which can only be inferred (if at all) by studying the hierarchical diversity of the lineage. These three lineages for example, must have spread from West Asia but they are relatively less important in numbers in that region today, overshadowed by other lineages, notably J. Instead their derived branches had major impacts in other regions (Europe, South and Central Asia, Siberia and America).


Frequencies of the main lineages

There are two main sub-lineages of R1a, which according to the current ISOGG tree version (maybe to be refitted after this study?) are known as R1a1a1b2 (Z93) and R1a1a1b1a (Z282). The first one is essentially Asian (with greatest frequencies in South and Central Asia, where it includes >98% of all R1a individuals) wile the latter is almost exclusively European (notably Eastern European but with a distinct branch in Scandinavia, encompassing together >96% of R1a individuals in Europe).


These maps give us a quite decent glimpse of the main scatter patterns of R1a but alone they can't inform us of its origins. For that we have to look at the detailed tree and the relationship of its samples with geography. 


Origins and distribution of R1a

As mentioned above, the authors conclude that R1a and R1a1 must come from Iran, where the greatest basal diversity is:
To infer the geographic origin of hg R1a-M420, we identified populations harboring at least one of the two most basal haplogroups and possessing high haplogroup diversity. Among the 120 populations with sample sizes of at least 50 individuals and with at least 10% occurrence of R1a, just 6 met these criteria, and 5 of these 6 populations reside in modern-day Iran. Haplogroup diversities among the six populations ranged from 0.78 to 0.86 (Supplementary Table 4). Of the 24 R1a-M420*(xSRY10831.2) chromosomes in our data set, 18 were sampled in Iran and 3 were from eastern Turkey. Similarly, five of the six observed R1a1-SRY10831.2*(xM417/Page7) chromosomes were also from Iran, with the sixth occurring in a Kabardin individual from the Caucasus. Owing to the prevalence of basal lineages and the high levels of haplogroup diversities in the region, we find a compelling case for the Middle East, possibly near present-day Iran, as the geographic origin of hg R1a.

Between these top tier nodes (R1a and R1a1) and the two most common sublineages described above, this study only found one paragroup represented: R1a1a1* (M417). This should be an important step in the analysis but the researchers prefer to remain silent on it. Why? I guess that the reason is that it is complicated to analyze and reach to sound conclusions. 

I spent some time today looking at the haplotypes of this paragroup mentioned in the study and I could not reach a conclusion either: the majority of the sequences are from Europe and all them (excepting a highly derived Norwegian line and including a low derived Iranian one) seem to derive from a North German haplotype. I call this group "branch A". 

However there is at least one West Asian sequence (from Turkey) which seems independent ("branch B"), while an Indian and the already mentioned Norwegian sequence could derive from either one. So my impression is that there is an specifically North European "branch A" but also some other stuff with West Asian centrality ("branch B") within this key paragroup. 

Guess that I could say a lot more about not being able to say much more on this key intermediate step but, synthetically there are two options among which I can't decide:
  • Branch A went back to West Asia from where it spread again to Eastern Europe and Central South Asia.
  • Branch B is actually at the origin of the two derived and highly spread subhaplogroups.
Whatever the case I understand that there are good reasons to think that these spread first from West Asia, at the very least Z93 and very likely also  Z282. 


R1a1a1b2 (Z93)

There is nothing European in this lineage: only some lesser terminal branches at the Southern Urals, roughly where the Kurgan phenomenon began some 6000 years ago. 

This detail is indeed remarkable because, if, as often argued, R1a or some of its subclades spread from there, we should expect at least some basal diversity being retained. Instead all we see are some highly derived branches. So the main conclusion must be that the expansion of R1a does not seem related to the Kurgan phenomenon, except maybe in some secondary instances. 

As mentioned before, this lineage is Central and South Asian and comprises the vast majority of R1a in those two regions. 

The detailed haplotype network can be seen in Supp. Info fig. 2.

In essence we can say that:
  • Z93* has three apparent distinct branches stemming from West Asia (incl. Caucasus) and another one from South Asia/Altai (1). 
  • Z95* has two apparent distinct branches:
    • A small one with presence in West Asia and Southern Europe
    • Another one (pre-M780?) stemming from South or West Asia
  • M780 has clear origins in South Asia (incl. most Roma lineages)
  • Z2125 also appears to originate in South Asia, even if it has a greater spread outside it, notably to Central Asia
  • M580 and M582 appear related and surely originated in West Asia
Weighting them:
  • Z95:
    • West Asia: 2
    • South Asia: 2
    • West/South Asia: 1
Therefore the origin of Z95 should be though as West-South Asian but undecided between either region. Say Afghanistan for example. 
  • Z93:
    • West Asia: 3
    • West/South Asia: 1 (Z95)
    • South Asia/Altai: 1 
In this case I would say that West Asia is almost certainly the origin, although tending to Central/South Asia. For example: Iran again. 

So, regardless of whether the previous stage (M417) represents a stay in West Asia or a back-migration from Europe into West Asia, West Asia is clearly at the origin of Z93. It does not represent any Kurgan migration but an Asian phenomenon with origins towards the West (around Iran).


R1a1a1b1a (Z282)

On first sight this European sublineage seemed quite simpler: it is obvious that the bulk of it spread from Eastern Europe. However, when we look at the haplotype network, we cannot confirm this pattern for the Norwegian or Scandinavian haplogroup Z284, which is only linked to the rest via some South European and West Asian samples. 

So my conclusion must be that Z282 experienced a main expansion from Eastern Europe but only into Eastern and Central Europe and that the Scandinavian variant almost certainly represents another flow within this haplogroup, with the knot being in West Asia. 

Anyhow the main East and Central European expansion seems true. For some reason it is not centered in any obvious prehistorical locality, as could be the Volga or maybe Ukraine, but instead its center is further North around Smolensk. 


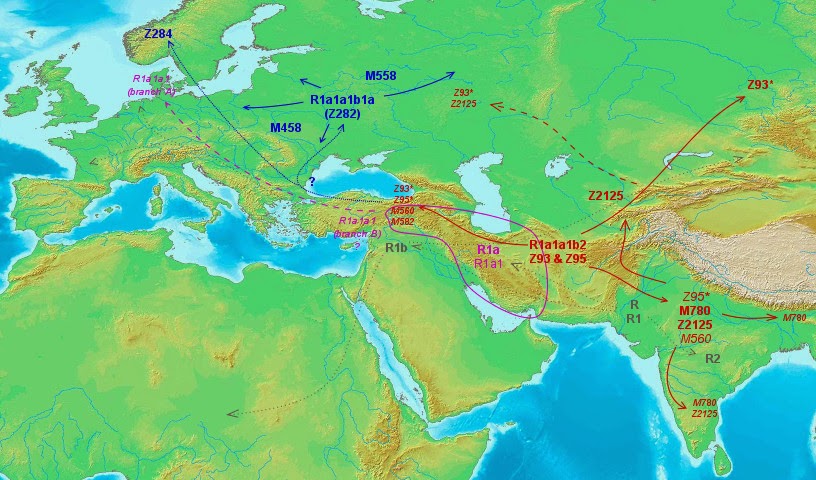
Overall reconstruction of the spread of R1a

With all the previous analysis I made this map, which also shows in discrete gray color the general pattern of expansion of haplogroup R:


We have an expansion of R into South Asia and Western Eurasia (incl. Central Asia) and even into parts of Africa (R1b-V88) from apparent South Asian (R, R1 and R2) and West Asian (R1a, R1b) origins. Related lineages Q and P* could also be integrated into this pattern of expansion but I did not want to overload the map with too many details. 

There is some uncertainty regarding the North European branches of R1a but otherwise the pattern seems quite clear. 

On these North European branches, I must say that they remind me of other odd lineages with similar geography: R1b-U106, I1-M253 and I2a2-M223. With the likely exception of R1b-U106 neither appears to have experienced any significant re-expansion since their arrival to that corner of the World, however they do seem to survive pretty well in it. 


Time frame?

Finally we seem to be entering the age of full Y chromosome sequencing and a more serious molecular clock based on it. As I have explained on other occasions (for example), the human Y chromosome is large enough to experience mutations almost every single generation, what should provide a decent molecular clock, unlike the very rough approximations used in the past. 

However the issue of correct calibration remains open. As you surely know the academy is slow to incorporate the most recent evidence, especially from fields distinct to their specialty. Hence I do not expect them to calibrate based on the obvious fact that age(CF) or at least age(F)=100,000 years. They are probably still stuck in old concepts of a "recent" out-of-Africa migration c. 60 or at most 80 Ka ago, as well as the usual Pan-Homo spilt under-estimates

I must reckon in any case that I had not enough time to study this matter in depth yet, so the previous observation is rather my idea of what to expect.

In any case in this study the authors resorted to full Y chromosome to calculate their age estimates and I applaud them for doing so. As apparent in fig. 5, all R1 derived sequences have approximately the same number of accumulated SNPs, what in principle allows for a perfected molecular clock, assuming it is well calibrated. 

Their estimate is as follows:
A consensus has not yet been reached on the rate at which Y-chromosome SNPs accumulate within this 9.99Mb sequence. Recent estimates include one SNP per: ~100 years,⁵⁸ 122 years,⁴ 151 years⁵ (deep sequencing reanalysis rate), and 162 years.⁵⁹ Using a rate of one SNP per 122 years, and based on an average branch length of 206 SNPs from the common ancestor of the 13 sequences, we estimate the bifurcation of R1 into R1a and R1b to have occurred ~25,100 ago (95% CI: 21,300–29,000). Using the 8 R1a lineages, with an average length of 48 SNPs accumulated since the common ancestor, we estimate the splintering of R1a-M417 to have occurred rather recently, B5800 years ago (95% CI: 4800–6800). The slowest mutation rate estimate would inflate these time estimates by one third, and the fastest would deflate them by 17%.
The references correspond to (4) Poznick 2013, (5) Francalacci 2013, (58) Xue 2009 and (59) Méndez 2013. This last is the Anzick study, of which at the very least we can say that they had a real calibration point in the ancient Amerindian DNA. It is also the one which provides the longest mutation rate. 

Considering that Xue 2009 is "old" (for this avant-guard aspect of this pretty young science), I find their choice of the Poznick rate quite a bit conservative. The Francalacci rate is the intermediate one of the three "recent" papers referenced and it is also quite close to the calibrated Méndez rate. 

Personally I would choose the later without a second thought. As long as CF ends up being younger than 100 Ka, it is positively too conservative anyhow.

Using the Méndez (Anzick-calibrated) rate of 162 years per SNP, I get the following corrected estimates:
  • R1a/R1b split (R1 node): 33,000 years ago (CI: 26.0-42.5 Ka)
  • R1a-M417 node: 7,700 years ago (CI: 6.4-9.0 Ka)

These seem fair enough to me, judging on the fact that the core R1a expansion seems to originate in West Asia (at the very least for the South/Central Asian branch), what fits much better with a Neolithic frame than with the Kurgan one.

It also fits better with my previous estimates after due re-calibration of Terry D. Robb's full sequence Y-DNA tree, although my estimates are even older, especially after a second recalibration to adjust to the recent discovery of widespread H. sapiens evidence in South and East Asia c. 100 Ka ago

In my understanding the R1 node is actually c. 48 Ka old (R1b: c. 34 Ka.), what, apportioning, yields a date of c. 11.2 Ka for the R1a-M-417 node. 


Update (Mar 31):best possible molecular clock estimates for R1:

Follows fig. 5 of Underhill et al. 2014, annotated by me in red and purple colors:


If I'm correct, then the expansion of R1b in Europe still corresponds in rough terms to the Magdalenian period or, more generally, the late Upper Paleolithic. This does not mean that it remained that way forever (it may well have been reshuffled later on: in the Epipaleolithic, Neolithic and Chalcolithic) but it seems to be the time-frame of its main expansion when the main lineages got established, whatever happened to them later on.

I know well that so far ancient DNA for this lineage remains to be found and that the dominant haplogroup among known Epipaleolithic hunter-gatherers was (for all we know) I2a. However this is what the refined full Y chromosome sequence molecular clock, properly calibrated according to the archaeological evidence for the settling of Asia by H. sapiens, has to say. If you wish to dismiss this and use another estimate instead, that's always up to you. I just hope that you know what you're doing.

Anyhow, if I am correct, then the expansion of R1a is neither Chalcolithic nor Neolithic but clearly Epipaleolithic. Does it make any sense? I can't say for sure because this period is not so well understood. Whatever the case, is it possible to integrate the key pre-Neolithic Zarzian culture of the Zagros (map) in this scheme of things? What about all the other question marks that fill the gaps of our mediocre knowledge of the Mesolithic of West Asia? Or is it the Balcanic Epigravettian to be blamed instead? Or both?

I really can't say with any certainty at this stage. But I am intrigued indeed.


Update (Mar 31): frequency pie charts of Underhill's data available at Kurdish DNA.


Update (Aug 2015): I must update the frequencies of the various upstream paragroups, in agreement with table S4, because I may have missed some details initially. However the overall tendency is the same.

  • R1a* (M420): Italy (1), Turkey East (1), Turkey Cappadocia (2), UAE (1), Oman (1), Iran (set 2) (2), Iran NE (1), Iran South (5), Iran North (5), Azeris-Iran (5).
  • R1a1* (SRY10831.2): Iran (set 2) (1), Iran NE (1), Iran South (2), Iran North (1), Kabardin (1). In addition it has more recently been found in two Epipaleolithic Eastern Europeans (EHG), from Karelia (Haak 2015) and Smolenskaya Oblast (Chekunova 2014).
  • Ra1a1a1* (M417): Ireland (1), Netherlands (3), Norway (1), South Sweden (1), Germany (1), Estonia (1), Hungary (1), Turkey East (Kurds) (1), Iran (set 3) (1), India South (1). 

January 26, 2014

Human Y chromosome undergoes purifying selection

A somewhat technical yet interesting study on Y chromosome evolution in humans:

Melissa A. Wilson Sayres et al., Natural Selection Reduced Diversity on Human Y Chromosomes. PLoS ONE 2014. Open accessLINK [doi:10.1371/journal.pgen.1004064]

Abstract

The human Y chromosome exhibits surprisingly low levels of genetic diversity. This could result from neutral processes if the effective population size of males is reduced relative to females due to a higher variance in the number of offspring from males than from females. Alternatively, selection acting on new mutations, and affecting linked neutral sites, could reduce variability on the Y chromosome. Here, using genome-wide analyses of X, Y, autosomal and mitochondrial DNA, in combination with extensive population genetic simulations, we show that low observed Y chromosome variability is not consistent with a purely neutral model. Instead, we show that models of purifying selection are consistent with observed Y diversity. Further, the number of sites estimated to be under purifying selection greatly exceeds the number of Y-linked coding sites, suggesting the importance of the highly repetitive ampliconic regions. While we show that purifying selection removing deleterious mutations can explain the low diversity on the Y chromosome, we cannot exclude the possibility that positive selection acting on beneficial mutations could have also reduced diversity in linked neutral regions, and may have contributed to lowering human Y chromosome diversity. Because the functional significance of the ampliconic regions is poorly understood, our findings should motivate future research in this area.


Positive selection (or directional selection) happens when a variant gets so good that everything else becomes bad by comparison. This may be just because an environmental change, possibly caused by migration (or whatever other reason) substantially alters the rules of the game. Much more rarely a novel mutation (or accumulation of several of them) may happen to generate a phenotype that is much more fit even for pre-existent conditions. As I understand it, positive selection does happen only rarely (but spectacularly). An example in humans is the selection of whiter skin shades in latitudes far away from the tropics (because of the "photosynthesis" of vitamin D in the skin, crucial for early brain development), another more generalized one is the selection for improved brains (not necessarily just bigger), able to face changing conditions more dynamically and develop more efficient tools and weapons.

Purifying selection (or negative selection) is quite different and surely much more common. As novel mutations arise randomly, in at least many cases, the vast majority I dare say, they happen to be harmful for a previously well-tuned genotype (and its derived phenotype). As result, the carriers have decreased opportunities for reproduction, when they don't just die right away. Natural selection acts mostly this way and in many cases the types can become very stable for this reason, as happens with genera that have been successful on this planet since long before humankind arose, such as sharks or crocodiles.

This last is what seems to be happening to the human Y chromosome: novel mutations are at least quite often harmful (maybe they cause sterility or whatever other traits in the male that cause decreased reproductive efficiency) and they are regularly pruned off the tree by natural selection. 


Purifying selection slows down the effective mutation rate

Interestingly the authors mention that:
... if purifying selection is the dominant force on the Y chromosome, the topology of the tree should remain intact, but the coalescent times are expected to be reduced.

That would be, I understand, because the observed mutation rate has little relation with the actual accumulated (effective) mutation rate, which is much slower because of the continuous pruning of the negative selection.

Purifying selection has also been observed in the mitochondrial DNA, having the same kind of slowing impact on the "molecular clock".

September 9, 2013

Homo sapiens was in China before 100,000 years ago!

This finding consolidates the recent dating of African-like industries of India to c. 96,000 years ago, as well as other previous discoveries from mostly China, and, jointly, they totally out-date not just the ridiculous "60 Ka ago" mantra for the migration out-of-Africa (which we know is dated to c. 125,000 years ago in Arabia and Palestine) but also the previous estimates of c. 80,000 years ago for India (Petraglia 2007).

Guanjung Shen et al., Mass spectrometric U-series dating of Huanglong Cave in Hubei Province, central China: Evidence for early presence of modern humans in eastern Asia. Journal of Human Evolution, 2013. Freely accessible at the time of writing thisLINK [doi:10.1016/j.jhevol.2013.05.002]

Abstract

Most researchers believe that anatomically modern humans (AMH) first appeared in Africa 160-190 ka ago, and would not have reached eastern Asia until ∼50 ka ago. However, the credibility of these scenarios might have been compromised by a largely inaccurate and compressed chronological framework previously established for hominin fossils found in China. Recently there has been a growing body of evidence indicating the possible presence of AMH in eastern Asia ca. 100 ka ago or even earlier. Here we report high-precision mass spectrometric U-series dating of intercalated flowstone samples from Huanglong Cave, a recently discovered Late Pleistocene hominin site in northern Hubei Province, central China. Systematic excavations there have led to the in situ discovery of seven hominin teeth and dozens of stone and bone artifacts. The U-series dates on localized thin flowstone formations bracket the hominin specimens between 81 and 101 ka, currently the most narrow time span for all AMH beyond 45 ka in China, if the assignment of the hominin teeth to modern Homo sapiens holds. Alternatively this study provides further evidence for the early presence of an AMH morphology in China, through either independent evolution of local archaic populations or their assimilation with incoming AMH. Along with recent dating results for hominin samples from Homo erectus to AMH, a new extended and continuous timeline for Chinese hominin fossils is taking shape, which warrants a reconstruction of human evolution, especially the origins of modern humans in eastern Asia.

The range of dates for the teeth is ample but the oldest one is of 102.1 ± 0.9 Ka ago. Other dates are very close to this one: 99.5 ± 2.2, 99.3 ± 1.6, 96.8 ± 1.0, etc. (see table 1), so there can be little doubt about their accuracy. 

The Huanglong teeth (various views)
 
Now, how solidly can these teeth be considered to belong to the species Homo sapiens? Very solidly it seems:
The seven hominin teeth from Huanglong Cave have been assigned to AMH mainly because of their generally more advanced morphology than that of H. erectus and other archaic populations (Liu et al., 2010b), especially in terms of the crown breath/length index. These teeth also lack major archaic suprastructural characteristics listed by Bermúdez de Castro (1988) for eastern Asian mid-Pleistocene hominins, such as “strong tuberculum linguale (incisors), marked lingual inclination of the buccal face (incisors and canines), buccal cingulum (canines and molars), wrinkling (molars), taurodontism (molars), swelling of the buccal faces (molars)” (Tim Compton, Personal communication). However, in their roots, these teeth still retain a few archaic features, being more robust and complicated than those of modern humans (Liu et al., 2010b).

Zhirendong jaw
Let's not forget that further South in China, in Zhirendong, a "modern" jaw was found and dated to c. 100,000 years ago as well.

As for the so-called "molecular clock":
The new timeline for human evolution in China is in disagreement with the molecular clock that posits a late appearance for AMH in eastern Asia (e.g., Chu et al., 1998).

... too bad for the "clock", because a clock that doesn't inform us of time with at least some accuracy is totally useless.
 

June 22, 2013

The less homogeneous European "populations" are Italians and French

This comes from a recent IBD study on Europe:

Peter Ralph & Graham Coop, The Geography of Recent Genetic Ancestry across Europe. PLoS Biology, 2013. Open accessLINK [doi:10.1371/journal.pbio.1001555] 
Abstract

The recent genealogical history of human populations is a complex mosaic formed by individual migration, large-scale population movements, and other demographic events. Population genomics datasets can provide a window into this recent history, as rare traces of recent shared genetic ancestry are detectable due to long segments of shared genomic material. We make use of genomic data for 2,257 Europeans (in the Population Reference Sample [POPRES] dataset) to conduct one of the first surveys of recent genealogical ancestry over the past 3,000 years at a continental scale. We detected 1.9 million shared long genomic segments, and used the lengths of these to infer the distribution of shared ancestors across time and geography. We find that a pair of modern Europeans living in neighboring populations share around 2–12 genetic common ancestors from the last 1,500 years, and upwards of 100 genetic ancestors from the previous 1,000 years. These numbers drop off exponentially with geographic distance, but since these genetic ancestors are a tiny fraction of common genealogical ancestors, individuals from opposite ends of Europe are still expected to share millions of common genealogical ancestors over the last 1,000 years. There is also substantial regional variation in the number of shared genetic ancestors. For example, there are especially high numbers of common ancestors shared between many eastern populations that date roughly to the migration period (which includes the Slavic and Hunnic expansions into that region). Some of the lowest levels of common ancestry are seen in the Italian and Iberian peninsulas, which may indicate different effects of historical population expansions in these areas and/or more stably structured populations. Population genomic datasets have considerable power to uncover recent demographic history, and will allow a much fuller picture of the close genealogical kinship of individuals across the world.


Most interesting in my understanding is table 1 (right), which describes the IBD relation of the sampled populations within themselves and with other Europeans.

From this table it seems very apparent that Italians and French are not homogeneous at all and therefore, in my opinion, should not be treated as single populations in genetic studies but butchered at least a bit by regions (whose optimal dimensions are yet to be determined).

The degree of internal homogeneity of the samples (only n=5 or greater) can be simplified as follows:
  • Very low (<1): Italy, France.
  • Quite Low (1-1.4): Germany, UK, Belgium, England, Austria, French-Swiss, 
  • Somewhat low (1.5-1.9): Spain, German-Swiss, Greece, Portugal, Netherlands, Hungary.
  • Somewhat high (2-2.9): Czech R., Romania, Scotland, Ireland, Serbia, Croatia,
  • Quite high (3-3.9): Sweden, Poland
  • Very high (4-5): Bosnia, Russia*
  • Extremely high (>10): Albania

Notes: 
  • I ignored strangely labeled samples like "Switzerland" and "Yugoslavia", which seem to mean actually "other" within these labels.  I retained the "United Kingdom" category for its large sample size, much larger than its obvious parts.
  • The level of relatedness of Russians may be exaggerated by the small sample: n=6, still above my cautionary threshold. 
  • I suspect that the extreme disparity of sample sizes may influence the results to some extent.

Eastern Europeans seem much more strongly related with others, especially other Eastern Europeans, than Western ones, while NW Europeans are more related with other groups (usually at regional level) than SW ones. In fact the Italian and Iberian peninsula show very low levels of "recent" relatedness with other populations, which is a bit perplexing, considering their non-negligible roles in Medieval and Modern European history. I guess that this may be partly caused by geographic barriers (mountains) and also by these areas having large populations since Antiquity or before. 

Figure 3. Geographic decay of recent relatedness.
In all figures, colors give categories based on the regional groupings of Table 1. (A–F) The area of the circle located on a particular population is proportional to the mean number of IBD blocks of length at least 1 cM shared between random individuals chosen from that population and the population named in the label (also marked with a star). Both regional variation of overall IBD rates and gradual geographic decay are apparent. (G–I) Mean number of IBD blocks of lengths 1–3 cM (oldest), 3–5 cM, and >5 cM (youngest), respectively, shared by a pair of individuals across all pairs of populations; the area of the point is proportional to sample size (number of distinct pairs), capped at a reasonable value; and lines show an exponential decay fit to each category (using a Poisson GLM weighted by sample size). Comparisons with no shared IBD are used in the fit but not shown in the figure (due to the log scale). “E–E,” “N–N,” and “W–W” denote any two populations both in the E, N, or W grouping, respectively; “TC-any” denotes any population paired with Turkey or Cyprus; “I-(I,E,N,W)” denotes Italy, Spain, or Portugal paired with any population except Turkey or Cyprus; and “between E,N,W” denotes the remaining pairs (when both populations are in E, N, or W, but the two are in different groups). The exponential fit for the N–N points is not shown due to the very small sample size. See Figure S8 for an SVG version of these plots where it is possible to identify individual points.

We can also see in the above figure (bottom) how most of the relatedness, especially along longer distances belongs to the oldest dates (1-3 cM).

The authors suggest that low heterogeneity within some of these groupings is influenced by regional variation, what makes good sense to me. This they illustrate with the examples of Italy and Great Britain:

Figure 2. Substructure in (A) Italian and (B) U.K. samples.
The leftmost plots of (A) show histograms of the numbers of IBD blocks that each Italian sample shares with any French-speaking Swiss (top) and anyone from the United Kingdom (bottom), overlaid with the expected distribution (Poisson) if there was no dependence between blocks. Next is shown a scatterplot of numbers of blocks shared with French-speaking Swiss and U.K. samples, for all samples from France, Italy, Greece, Turkey, and Cyprus. We see that the numbers of recent ancestors each Italian shares with the French-speaking Swiss and with the United Kingdom are both bimodal, and that these two are positively correlated, ranging continuously between values typical for Turkey/Cyprus and for France. Figure (B) is similar, showing that the substructure within the United Kingdom is part of a continuous trend ranging from Germany to Ireland. The outliers visible in the scatterplot of Figure 2B are easily explained as individuals with immigrant recent ancestors—the three outlying U.K. individuals in the lower left share many more blocks with Italians than all other U.K. samples, and the individual labeled “SK” is a clear outlier for the number of blocks shared with the Slovakian sample.

In the UK, there is a negative correlation between blocks shared with Ireland and those shared with Germany, what seems to imply a dual origin of Britons. 


Age estimates (double them?):

The authors also get to estimate ages, however it seems obvious from their own data that the results should be multiplied by 2.2 or something like that to make good sense:

Figure 4. Estimated average number of most recent genetic common ancestors per generation back through time.
Estimated average number of most recent genetic common ancestors per generation back through time shared by (A) pairs of individuals from “the Balkans” (former Yugoslavia, Bulgaria, Romania, Croatia, Bosnia, Montenegro, Macedonia, Serbia, and Slovenia, excluding Albanian speakers) and shared by one individual from the Balkans with one individual from (B) Albanian-speaking populations, (C) Italy, or (D) France. The black distribution is the maximum likelihood fit; shown in red is smoothest solution that still fits the data, as described in the Materials and Methods. (E) shows the observed IBD length distribution for pairs of individuals from the Balkans (red curve), along with the distribution predicted by the smooth (red) distribution in (A), as a stacked area plot partitioned by time period in which the common ancestor lived. The partitions with significant contribution are labeled on the left vertical axis (in generations ago), and the legend in (J) gives the same partitions, in years ago; the vertical scale is given on the right vertical axis. The second column of figures (F–J) is similar, except that comparisons are relative to samples from the United Kingdom.

I say that mainly because the shared ancestry between Balcans and both Italy and France is dated here to around 3000 or 3500 years ago, when it would fit much better to c. 7500 years ago (as much as 8000 BP for some parts of Italy), when the Neolithic expansion was ongoing. There is no particular reason why the Balcans would be related to France and Italy c. 3000 years ago specifically, unless one believes in undocumented massive Mycenaean migrations or something like that (and what about Albania then?)

However I am getting a headache with this issue because no correction, low or high seems good enough for all pairs, so, well, just take this part with your usual dose of healthy skepticism.

Some (annotated) excerpts:

In most cases, only pairs within the same population are likely to share genetic common ancestors within the last 500 years [i.e.: ~1100 years]. Exceptions are generally neighboring populations (e.g., United Kingdom and Ireland). During the period 500–1,500 ya [i.e. ~1100-3300 years ago: most of the Metal Ages], individuals typically share tens to hundreds of genetic common ancestors with others in the same or nearby populations, although some distant populations have very low rates. Longer ago than 1,500 ya [i.e. before ~3300 years ago: before the Late Bronze Age crisis], pairs of individuals from any part of Europe share hundreds of genetic ancestors in common, and some share significantly more.

On Italy:
There is relatively little common ancestry shared between the Italian peninsula and other locations, and what there is seems to derive mostly from longer ago than 2,500 ya [i.e. ~5500 y.a.: Megalithic era onwards]. An exception is that Italy and the neighboring Balkan populations share small but significant numbers of common ancestors in the last 1,500 years [i.e. after 3750 years: since the Mycenaean period] ...

On Iberia:
Patterns for the Iberian peninsula are similar, with both Spain and Portugal showing very few common ancestors with other populations over the last 2,500 years [i.e. 5500 years: Megalithic era onwards]. However, the rate of IBD sharing within the peninsula is much higher than within Italy... 

The low Iberian relationship with other populations seems to preclude this region as source for the conjectured re-expansion of mtDNA H and other Western lineages. I would suggest looking to (Western) France for an alternative source, as this state's heterogeneous population shares more intense relations with other Western peoples around what could be c. 6200 BP, what is at the very beginning of Megalithic spread in Atlantic Europe, for which Armorica (Brittany and neighboring Western France) could well have been a major source (and definitely was in the case of Britain).

Of course, if you prefer to use the authors' estimates, it would have no influence on the hypothesis because they simply can't reach so far back in time, it seems. But I feel more comfortable overall reformulating the hypothesis towards Armorica.

For better reading of each pair of relationships through time, I include here fig. S16:


The maximum likelihood history (grey) and smoothest consistent history (red) for all pairs of population groupings of Figure S12 (including those of Figure 5). Each panel is analogous to a panel of Figure 4; time scale is given by vertical grey lines every 500 years. For these plots on a larger scale, see Figure S17.

As said before, I suggest to read each vertical grey line (counting from left) as meaning ~1100 years rather than just 500.


Update (Jun 23): on IBD-based molecular-clock-o-logy:

I have now and then found strange insistence on IBD-based chronological estimates being almost beyond reasonable doubt. I admittedly don't know a great deal on the matter, so when Davidski (see comments) insisted again on that, I asked him for a reference, so I could learn something. He kindly suggested me to read Gusev et al. 2011, The Architecture of Long-Range Haplotypes Shared within and across Populations, which is indeed a good paper. However I could not find the clearly explained basis for the chronological estimates in general, probably buried deep in the bibliography. What I found instead was a clear example of these being short from historical reality by a lot.

This example corresponds to one of the best documented populations to have suffered a "recent" bottleneck event: Ashkenazi Jews (AJ). According to Gusev et al., these would have suffered a bottleneck (founder effect of some 400 nuclear families followed by expansion) around 20 generations ago (~600 years = 1400 CE) or, a few lines later more specifically: 23 generations ago (~1320 CE). So here we do have a clear case study.

When we look at historical reality however, it is just impossible that AJ would have their founder effect bottleneck so late. Historical records document them often already in the Frankish period and they were definitely a vibrant expanding community by the time of the founding of Prague and Krakov c. 900 CE. A historical reasonable estimate for the AJ founder effect should be instead c. 700 CE, when they begin to appear in historical records, or maybe even a bit earlier, because of the lack of documentation in the Dark Ages.

That is not at all a mere 20-23 generations ago but almost double (counting generation time = 30 years, if gen-time would be 27 years, for example, the difference between estimates and reality would be even greater). Assuming a very reasonable AJ founder effect at 700 CE, then:
  • For gen-time = 30 years → 43 generations till now → 43/23 = 1.9 times for realistic correction
  • For gen-time = 27 years → 48 generations → 48/23 = 2.1 times for realistic correction
  • For gen-time = 25 years → 52 generations → 52/23 = 2.3 times for realistc correction
While it has become nowadays standard issue to assimilate generation time to 30 years, this is not any absolute measure because the actually observed generation time (i.e. the age difference between parental and child generations on average) varies in real life depending on cultural factors (such as marriage age), gender (female generation time is almost invariably shorter than male), life expectancy (mothers dead at birth at young age, for example, don't have any more children), etc. So it is in the fine detail a somewhat blurry issue, with some significant variability among cultures and surely also through time.

Another issue is if this "short term" estimate correction is stable along time or does in fact vary somewhat. I can't say.

Whatever the case, the approximate x2 correction proposed above, seems to stand in general terms.