A paper of some interest is available these days at the Public Library of Science:
Andrey V. Kruhnin et al., A Genome-Wide Analysis of Populations from European Russia Reveals a New Pole of Genetic Diversity in Northern Europe. PLoS ONE 2013. Open access → LINK [doi:10.1371/journal.pone.0058552]
Abstract
Several studies examined the fine-scale structure of human genetic variation in Europe. However, the European sets analyzed represent mainly northern, western, central, and southern Europe. Here, we report an analysis of approximately 166,000 single nucleotide polymorphisms in populations from eastern (northeastern) Europe: four Russian populations from European Russia, and three populations from the northernmost Finno-Ugric ethnicities (Veps and two contrast groups of Komi people). These were compared with several reference European samples, including Finns, Estonians, Latvians, Poles, Czechs, Germans, and Italians. The results obtained demonstrated genetic heterogeneity of populations living in the region studied. Russians from the central part of European Russia (Tver, Murom, and Kursk) exhibited similarities with populations from central–eastern Europe, and were distant from Russian sample from the northern Russia (Mezen district, Archangelsk region). Komi samples, especially Izhemski Komi, were significantly different from all other populations studied. These can be considered as a second pole of genetic diversity in northern Europe (in addition to the pole, occupied by Finns), as they had a distinct ancestry component. Russians from Mezen and the Finnic-speaking Veps were positioned between the two poles, but differed from each other in the proportions of Komi and Finnic ancestries. In general, our data provides a more complete genetic map of Europe accounting for the diversity in its most eastern (northeastern) populations.
I'm not too sure of how to analyze this paper because, on one side, there's some missing data, especially in regards to the ADMIXTURE analysis (FST distances between components) and then for some reason the Chinese control was totally removed from further analysis as well, making very difficult for example to estimate if and how much East Asian admixture exists in these NE European populations. Then on the other side, nearly all Finno-Ugrian peoples (as well as the Mezen Russians, genetically Finno-Ugrian as well) are highly endogamous peoples, what almost invariably distorts ADMIXTURE analysis by creating many localized components of dubious relevance.
The ADMIXTURE analysis was presented, as often happens quite incorrectly, for values under the cross-validation optimum, which in this case is at least known: K=6 and K=7 (very similar lowest values):
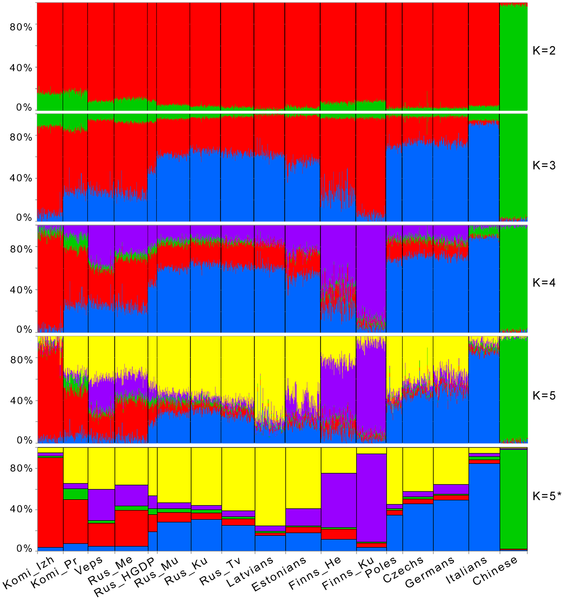 |
Figure 4. ADMIXTURE clustering of individuals from the populations studied.
Results obtained at K = 2 to 5 are shown. Each individual is represented by a vertical line composed of colored segments, in which each segment represents the proportion of an individual’s ancestry derived from one of the K ancestral populations. Individuals are grouped by population (labeled on the bottom of the graph). In addition to populations used in principal component analysis, a Chinese sample (Han Chinese from Beijing [22]) was included. The results at K = 5 are also accompanied by average ancestral proportions by population (*). Population designations are the same as in Figure 1.
[From fig. 1:] Key: Komi_Izh – Izhemski Komi, Komi_Pr – Priluzski Komi, Rus_Tv – Russians from Tver, Rus_Ku – Russians from Kursk, Rus_Mu – Russians from Murom, Rus_Me – Russians from Mezen, Finns_He – Finns from Helsinki, Finns_Ku – Finns from Kuusamo, Rus_HGDP – Russians from the Human Genome Diversity Panel.
|
At least in the supplemental materials we find the missing K-values:
 |
Figure S4. Results of ADMIXTURE clustering at K = 6 to 8. The number of populations and their order are the same as at Figure 4.
[Note: per fig. S5, the optimal K-values are K=6 and K=7] |
Something that may call your attention is the relatively high value of the Chinese component in Italians (Tuscans, judging on the locator map). This anomalous effect (unheard of in other studies) may well be caused because a West Asian control is clearly missing and Italians have relatively high West Asian affinity, being otherwise relatively isolated within this Northern European sample.
Notice also how every single endogamous Finno-Ugric population forms their own cluster: a generic Finno-Ugrian component at K=3 (red), a distinction between the Komi and the Finnic component at K=4 (red and purple), then at K=5 we get a mini-break with a more general North/South Europe distinction showing up (yellow and blue components), but at "optimal" K=6 and K=7, we still see other localized components forming: first Komi_Pr (brown) and then the Vepsian one (grey). So out of seven "optimal" components (K=7), four are local corresponding to highly endogamous populations.
But I'm running a bit ahead of myself, admittedly. The endogamy index is analyzed as ROH values: nROH for the mean and cROH for the average:
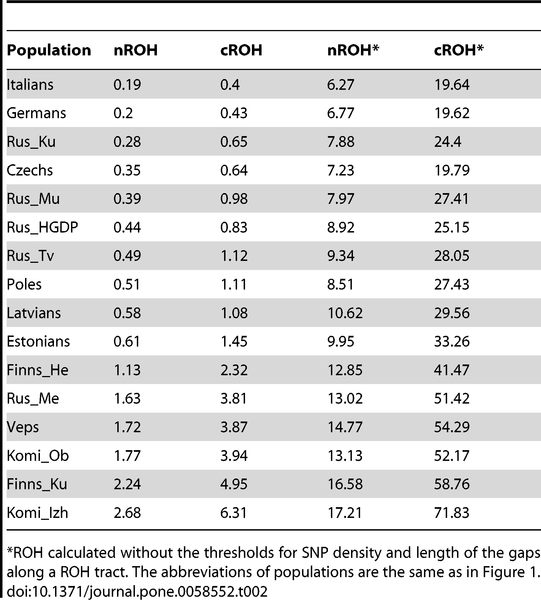 |
| Table 2. Summary of ROH statistics of 16 European populations. |
We can see here that large and relatively cosmopolitan populations like Germans and Italians have low ROH values. Czechs and Central Russians come next, with Poles already showing a bit higher endogamy index. Latvians and Estonians are still relatively low but Northern Finno-Ugrian peoples (including Mezen Russians) deviate a lot, with values (at the non-asterisk columns) that are at best almost double than those for Estonians and, at worst, six times higher.
So in this particular case, and quite exceptionally, I'd say that K=2 or K=3 are the most realistic K-values, in spite of scoring quite poor in the cross-validation test. Of course that the N-S European distinction shown at K=5 is also real and not caused by any "effect" but otherwise the clusters showing up correspond to extreme drift caused by isolation and endogamy and therefore only tell us about that peculiarity of the European Far North.
K=2 is surely the most informative level for East Asian genetic influence, except for the already mentioned Italian anomaly (which may also affect to lesser extent Central Europeans). However because this study is so limited in this aspect, I'd encourage the development of more informative studies, which could for example ponder the FST distances between components, always informative, and/or use other population sampling strategies that better capture this aspect.
After all this is a study focused on Russia, even if that way it has also produced some valuable information for much of NE Europe.
 |
Figure 3. Principal component
analysis of the combined autosomal genotypic data of individuals from
Russia and seven European countries (Finnland, Estonia, Latvia, Poland,
Czech Republic, Germany [5] and Italia [22]).
The
first two PCs are shown. The color legend for the predefined population
labels is indicated within the plot. Population designations are the
same as in Figure 1. |
Appendix: Finno-Ugrian peoples/languages map by Marting/Nug (anti-copyright):


