Important update (Feb 9 2014): the paper was formally corrected, after a long bureaucratic struggle, in February 2014. I wrote a new review for the occasion: → HERE.
This study is rather chaotic and poorly presented with potentially interesting but very confusingly reported data Italian paternal and maternal lineages, after we wade through the hyper-obsolete and sometimes sloppy nomenclature they use and the many bugs in the presentation of the data.
***********************************************************
This study is rather chaotic and poorly presented with potentially interesting but very confusingly reported data Italian paternal and maternal lineages, after we wade through the hyper-obsolete and sometimes sloppy nomenclature they use and the many bugs in the presentation of the data.
Their attempt to say anything of the autosomal genetics is rather useless, confusing and pointless however and will not be discussed here.
Francesca Brisighelli et al., Uniparental Markers of Contemporary Italian Population Reveals Details on Its Pre-Roman Heritage. PLoS ONE 2012. Open access → LINK [doi:10.1371/journal.pone.0050794]
Abstract
Background
According to archaeological records and historical documentation, Italy has been a melting point for populations of different geographical and ethnic matrices. Although Italy has been a favorite subject for numerous population genetic studies, genetic patterns have never been analyzed comprehensively, including uniparental and autosomal markers throughout the country.
Methods/Principal Findings
A total of 583 individuals were sampled from across the Italian Peninsula, from ten distant (if homogeneous by language) ethnic communities — and from two linguistic isolates (Ladins, Grecani Salentini). All samples were first typed for the mitochondrial DNA (mtDNA) control region and selected coding region SNPs (mtSNPs). This data was pooled for analysis with 3,778 mtDNA control-region profiles collected from the literature. Secondly, a set of Y-chromosome SNPs and STRs were also analyzed in 479 individuals together with a panel of autosomal ancestry informative markers (AIMs) from 441 samples. The resulting genetic record reveals clines of genetic frequencies laid according to the latitude slant along continental Italy – probably generated by demographical events dating back to the Neolithic. The Ladins showed distinctive, if more recent structure. The Neolithic contribution was estimated for the Y-chromosome as 14.5% and for mtDNA as 10.5%. Y-chromosome data showed larger differentiation between North, Center and South than mtDNA. AIMs detected a minor sub-Saharan component; this is however higher than for other European non-Mediterranean populations. The same signal of sub-Saharan heritage was also evident in uniparental markers.
Conclusions/Significance
Italy shows patterns of molecular variation mirroring other European countries, although some heterogeneity exists based on different analysis and molecular markers. From North to South, Italy shows clinal patterns that were most likely modulated during Neolithic times.
As the data is so poorly presented, I decided to rework it all myself. This is the mtDNA map (made recycling figs. 1 and 4 on a map of Italy):
 |
| Italian mtDNA - on Brisighella 2012 - click to expand |
We can see that the apportions of haplogroups are generally in agreement with what we can find in Western Europe, showing some minor but evident differences in the South: high frequency of J, more T and X than in the North and Center, less W, H and V, presence of rare lineages in the N* and M* categories.
However warning must be made that the Northern and Central pie charts are so exactly identical that it looks like an error was made (and either one was copied twice). I don't have time right now to research this so obvious error, checking the supp. material and what not, but be warned that there is a bug (this bug is reproduced here from fig. 1 as-it-is).
Southern highlight populations (Salentine Greeks and Lucerans, a town where Sicilian Muslims where deported to in the Middle Ages) appear to be very similar to Southern Italians in general. Instead the Ladins appear to retain a more Paleolithic-looking mtDNA pool, dominated by H, U and V. However notice that K (often considered a Neolithic haplogroup) is not mentioned separately from its parent U.
I did the same with Y-DNA, however here the difficulty is in the horribly chosen nomenclature:
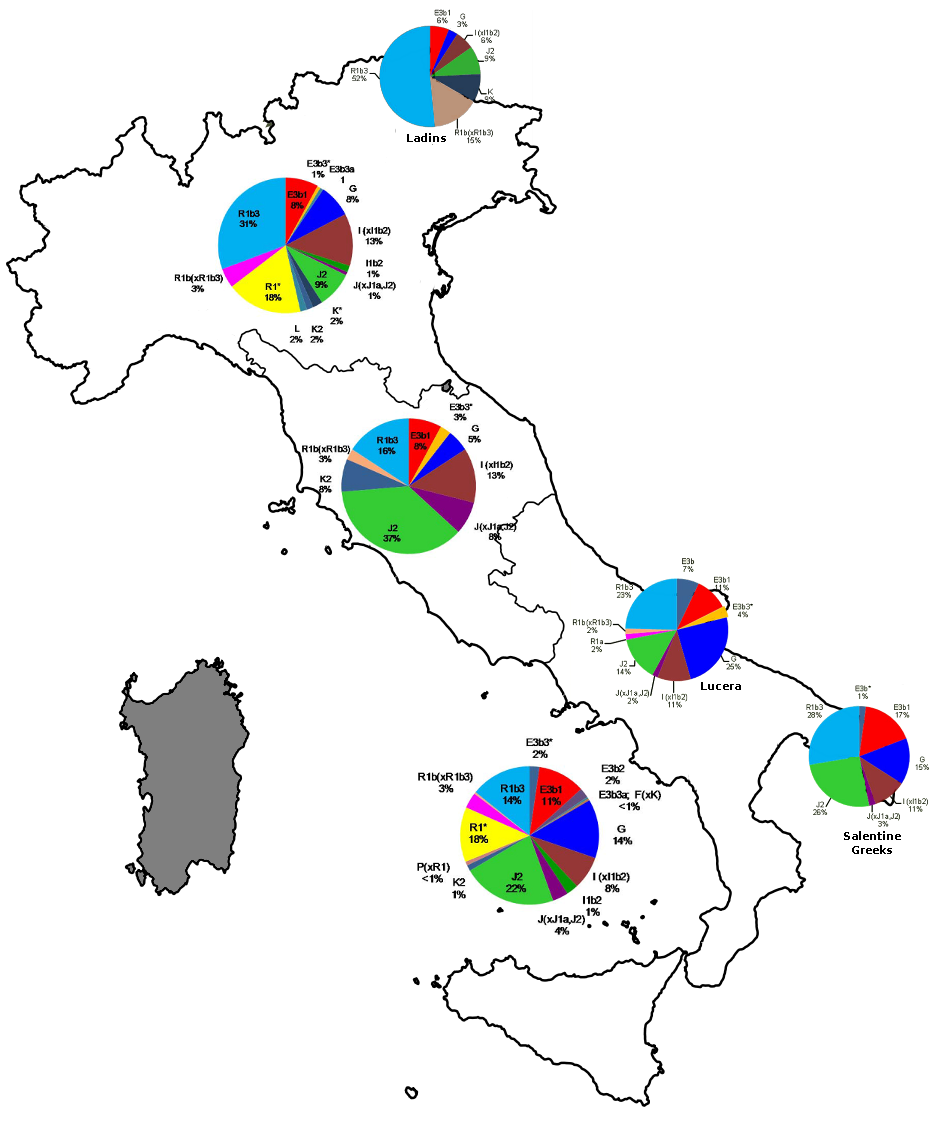 |
| Italian Y-DNA - on Brisighella 2012 - click to expand |
Before you jump to any conclusion from the map above, you must note that the haplogroups are all poorly described. I checked ISOGG present day nomenclature and annotated fig. 3 (in grey) so we can get a more clear idea of what they are trying to describe:
 |
| Fig. 3 of Brisighella 2012 Phylogeny of Y-chromosome SNPs and haplogroup frequencies in different Italian populations. (annotated by Maju) - click to expand - |
Notice also apparent inconsistencies on the labeling, notably how R1* becomes R1b3 (sic) among Ladins, Lucerans and Salentine Greeks.
In truth it's very difficult to get anything straight from this paper because there is such sloppiness in the presentation of the data that we can only end with a headache and greater confusion than when we started.
Therefore I must renounce to make any attempt of analysis, sadly enough.
At least one thing one can get out of this paper is that, uni-parentally, Southern Italians are very diverse, whereas NE Italians are not, with the latter much more similar to non-east-Mediterranean (central and western) Europeans.
ReplyDeleteA lot has changed in the Eastern Mediterranean since the Bronze Age - but I think one has to be very careful and not extrapolate that to all of Europe - which unfortunately is frequently done.
What do you mean by NE Italians? The sample from Udine or the Ladins?
DeleteI took a quick look to the diversity tables earlier and, excepting Elba island, I did not notice any pocket of low diversity (mtDNA-wise). Y-DNA-wise again Elba and also the Ladins are strikingly low. It's true that Y-DNA-wise some increase of diversity appears towards the South but NE Italy (Udine and such) does not look too low: Udine vs. Liguria are similar for all values for example. By matrilineages, Northern high altitude areas like Arezzo or Torino are among the most diverse, competing with the Southern diversity leaders like Catania or Calabria.
Sorry for the confusion - I meant Ladins.
ReplyDelete